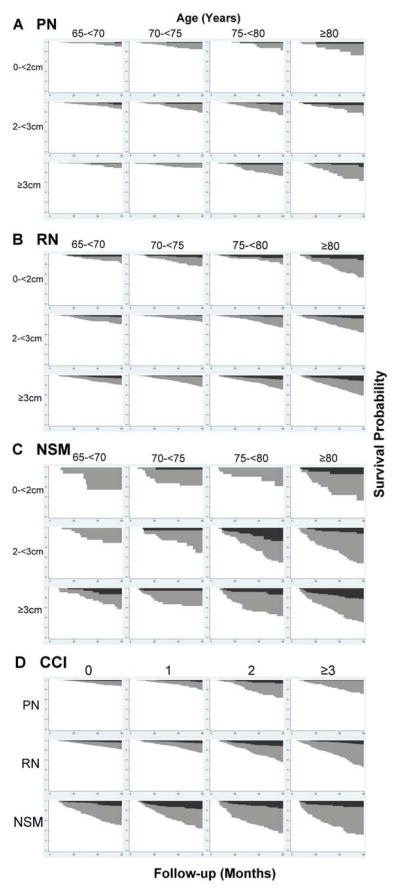
Figure.
Survival Curves (white) Stratified by Age and Tumor Size for (A) PN, (B) RN, and (C) NSM and Stratified by CCI (D) with overlaid inverted Cumulative Incidence Functions for Kidney Cancer Mortality (black) and Other-Cause Mortality (grey). NSM = nonsurgical management, PN = partial nephrectomy, RN = radical nephrectomy, CCI = Charlson comorbidity index.

