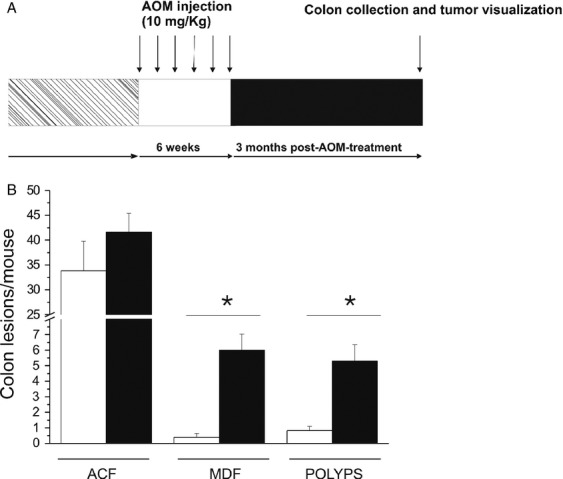
Figure 3.

Effect of AOM treatment in hERG1 TG mice. (A) Outline of AOM treatment: six control mice and 12 TG mice, maintained in a C57Bl6/FVB mixed background, received, at 2 months after birth, IP injections of AOM (10 mg/kg body weight) once a week for 6 weeks and were killed 3 months after the last injection. (B) The number of ACF, MDF, and polyps that developed in control (white bars) and TG (black bars)-treated mice was determined. Data were expressed as mean ± SEM. Statistical analysis was conducted using the Mann–Whitney U test (*significantly different with a P-value of <0.01).
