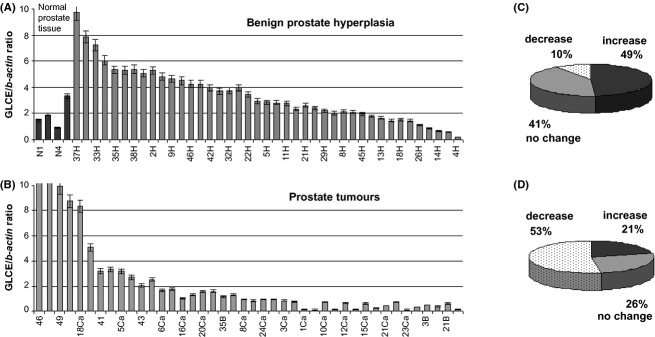
Figure 1.

GLCE expression in normal human prostate tissue, benign prostate hyperplasia, and prostate tumors. (A, B) Real-time RT-PCR analysis of GLCE expression. Intensity of the amplified GLCE DNA fragments normalized to that of b-actin. Bars represent the mean ± SD from triplicate experiments (OriginPro 8.1). (C, D) Summary diagrams for the clinical sample distribution according the GLCE mRNA levels changes compared with the average GLCE level in normal prostate tissues (1.92 ± 1.04). A 50% cutoff value was considered significant.
