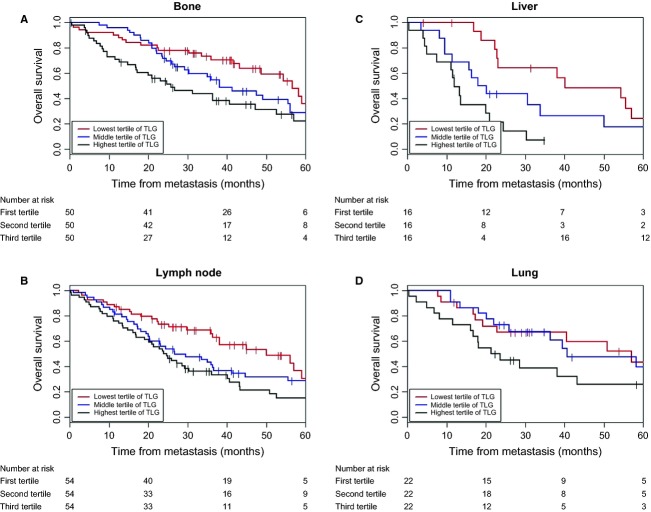
Figure 2.
Kaplan–Meier curves of overall survival (OS) according to total lesion glycolysis tertiles (TLG) in (A) bone, (B) lymph node, (C) liver, and (D) lung. Time point zero is defined as the date of diagnosis of metastatic disease. Number of patients at risk for death at selected time points is displayed below each graph.

