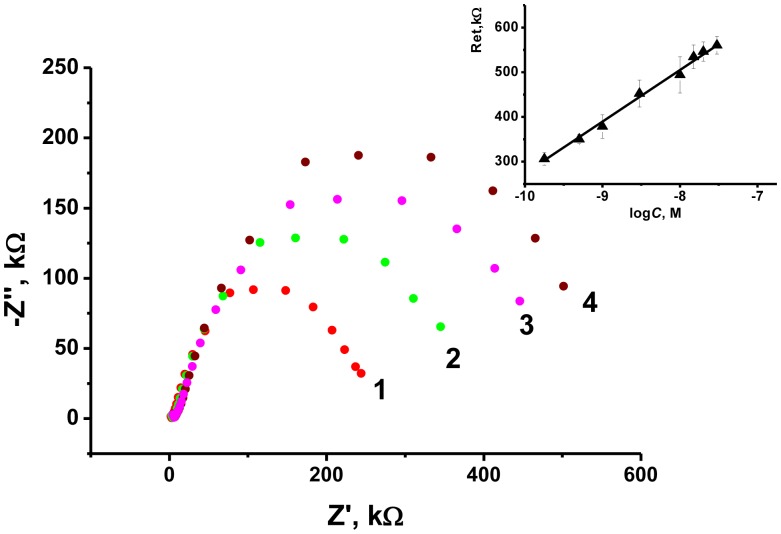
Figure 8.
Nyquist diagrams of impedance spectra obtained prior to (1) and after addition of 1.0 (2), 10 (3) and 100 (4) nM OTA and the dependence of the charge transfer resistance on the logarithm of the OTA concentration (inset). Measurements in the presence of 0.01 M K3 [Fe(CN)6] and 0.01 M K4 [Fe(CN)6] at 0.235 V vs. Ag/AgCl. Frequency range 0.04 Hz–100 kHz, ac voltage amplitude: 5 mV.

