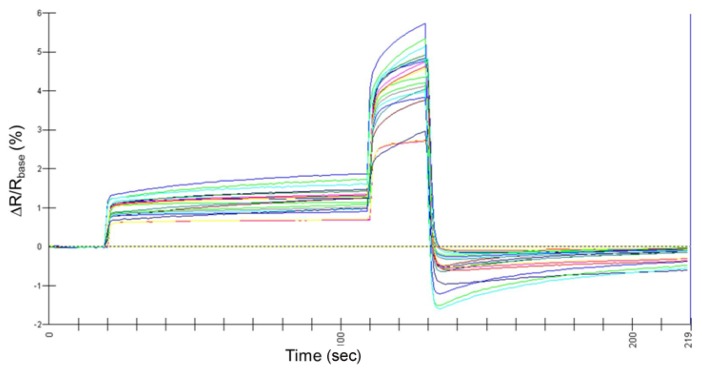
Figure 1.
Typical sensor output responses of all twenty sensors in the Aromascan A32S e-nose sensor array to headspace volatiles from catfish meat samples tested for the presence of off-flavor compounds by conductive polymer analyses (CPA). Data values for each graphed line indicate mean percentage change in sensor electrical resistance relative to baseline resistance (ΔR/Rbase%) with each colored line representing a separate sensor output from the sensor array.

