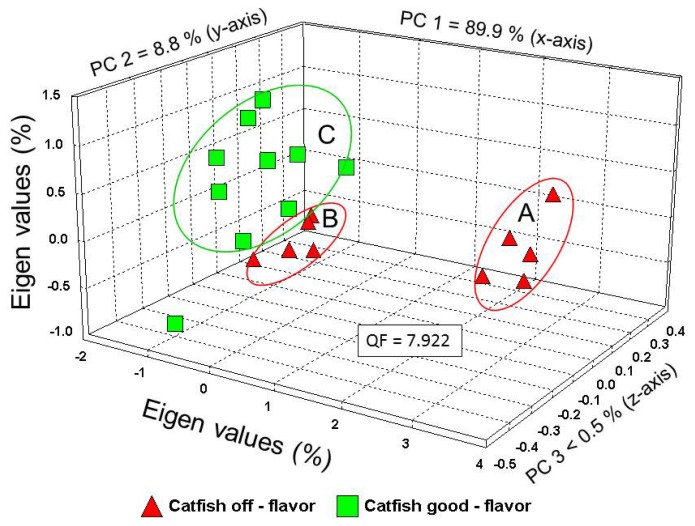
Figure 3.
Aroma map of headspace volatiles from good-flavor vs. off-flavor catfish meat samples (aroma classes) based on principal component analysis (PCA). The percentages of the total variance, accounting for the variability explained by each orthogonal principal component (PC), are as follows: PC 1 = 88.9%, PC 2 = 8.8%, and PC 3 < 0.5%. The Quality Factor (QF) value of significant difference between the aroma profiles of good-flavor vs. off-flavor catfish meat samples was QF = 7.922, indicating a significant statistical difference between these two aroma classes at P < 0.05.

