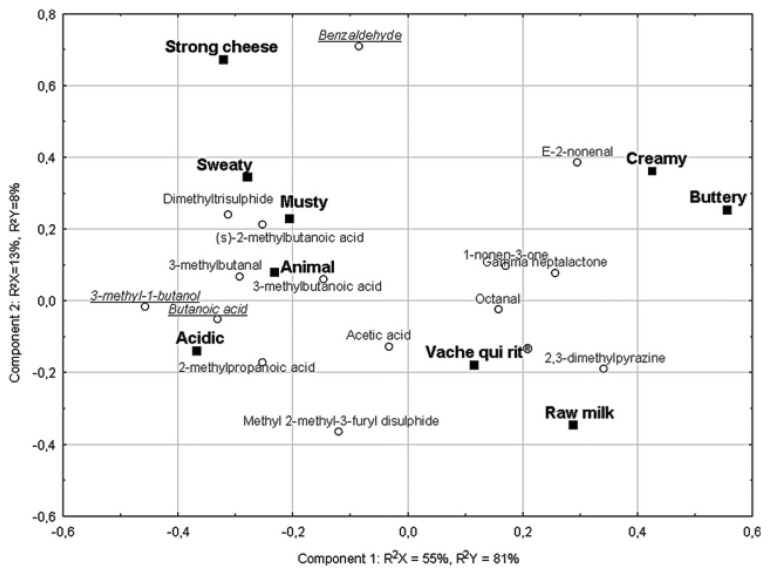
Figure 7.
Bi-plot of the two first components as a result of PLS analysis of the sensory profiles (Y matrix, black) and the GC-O intensity measurements for the odor-active compounds (X matrix, grey) (reprinted from [173] with permission from Elsevier).

