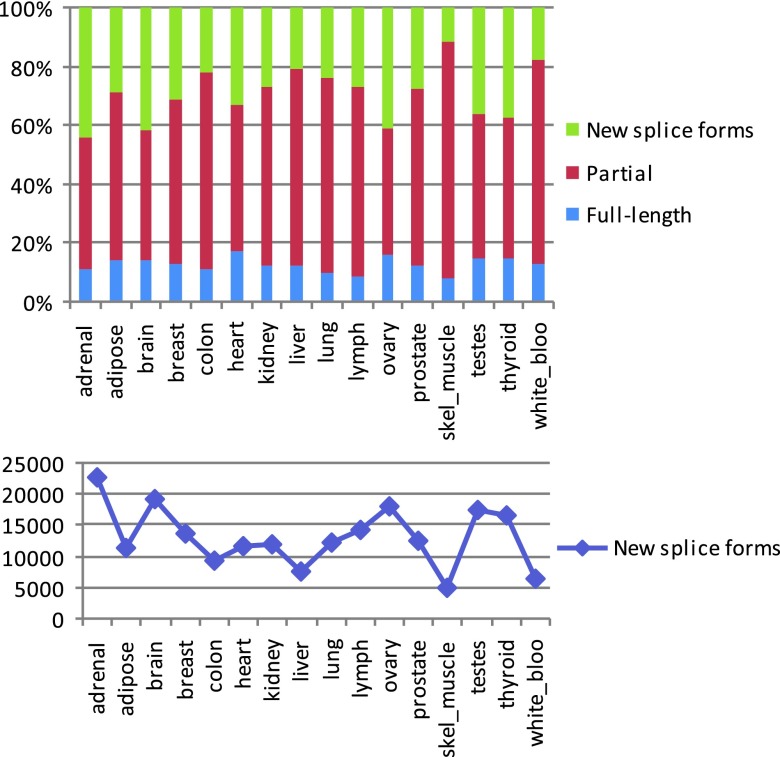
Figure S3. Proportion of predicted novel splice forms from the total number of transcript assemblies, including novel and known (top), and absolute counts of novel splice forms (bottom) detected in the 16 tissues.
Novel and known isoforms are determined by comparison with ENSEMBL v.61 gene annotations using the program Cuffcompare (see caption to Table S3 for more details).

