
Figure S7. Histograms of reads in the 16 tissue samples supporting the two introns flanking the alternatively spliced exon (blue, red) and the intron spanning the exon (green), respectively, for the 26,989 identified exon skipping events.
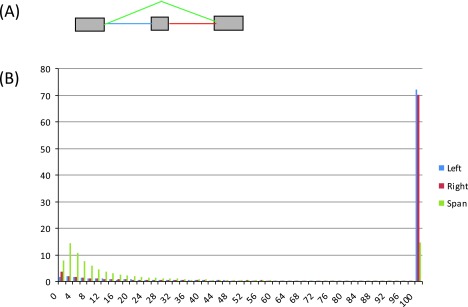
( A) Diagram of an exon skipping event, illustrating the three types of introns: left – blue, right – red, and intron spanning – green. ( B) Read histograms for the three categories of introns. The x-axis represents the number of supporting reads for an intron, grouped in bins, and the y-axis shows the percentage of introns by levels of supporting reads (in bins).