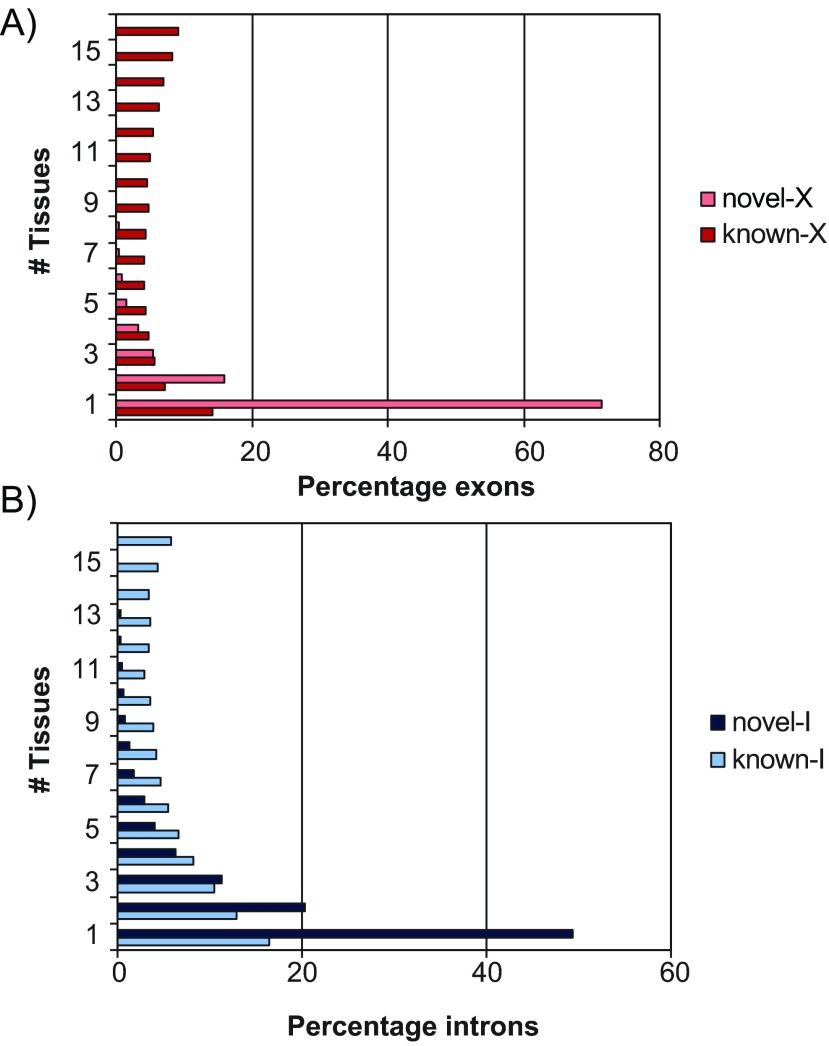
Figure 5. Distribution of novel and known features by the number of tissues in which they occurred.
( A) The percentage of exons found in 1, 2, …, 16 tissues are shown as horizontal bars, for the 2,914 novel exons (‘novel-X’) and 24,075 known exons (‘known-X’). ( B) Similarly for the 15,958 novel introns (‘novel-I’) and 11,031 known introns (‘known-I’).

