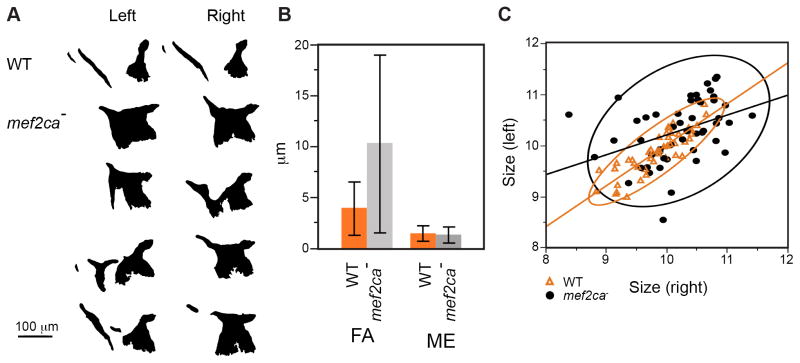
Fig. 2. Mutant OpBR shapes and sizes show hallmarks of developmental instability.
(A) Example left-right OpBR pairs, shown as silhouettes with right-side bones flipped horizontally to match the orientation of the left-side bones. The examples include a wild type (upper) and four individual mutants. Note that the left side of the lowermost example looks similar to wild type while the right side is very dissimilar. (B) Fluctuating asymmetry (FA) of bone sizes are higher in the mutant than in the wild type (P<0.0001, ANOVA). Measurement error (ME) is low. Error bars show standard deviations. FA showed a normal distribution among both wild types and mutants (Shapiro-Wilk test implemented in JMP). Directional (left-right) asymmetry was not detected. (C) Left-right correlations of OpBR size (WT: R2=0.74, p<0.0001*, mutant: R2=0.156, p=0.004*). Regression lines and 95% density ellipses included.

