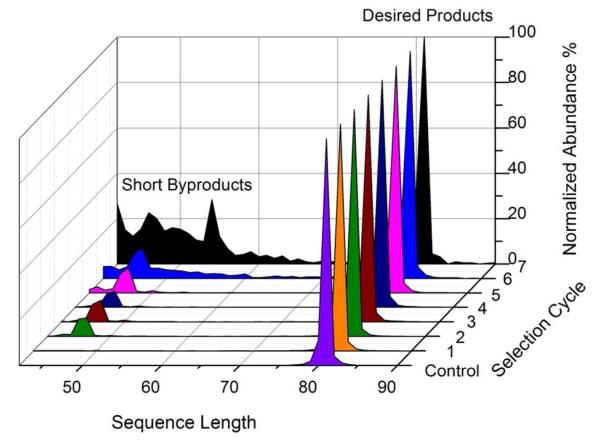
Figure 3.
Normalized sequence length distributions of the control and each selected pool. Each distribution was normalized to the abundance of the 80 nt sequences. Only sequences with the length equal to or above 42 nt were exported after 454 sequencing, so 42 nt was chosen as one boundary. 90 nt was chosen as the upper boundary since very few sequences were observed beyond this length

