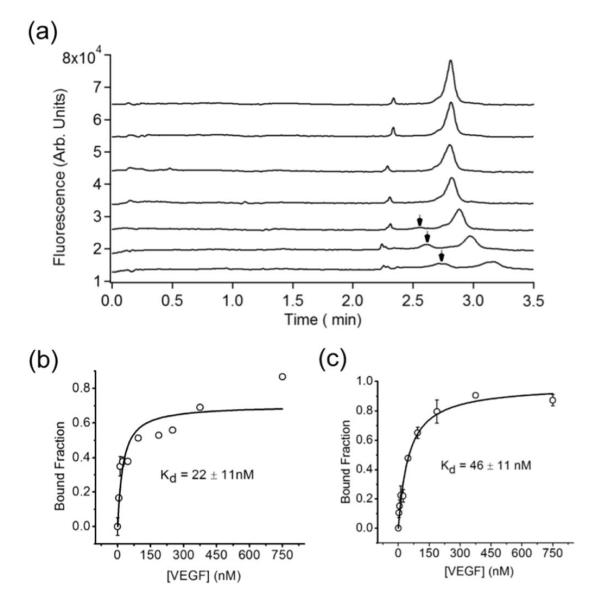
Figure 6.
(a) An overlay of electropherograms from one ACE experiment, titrating 5 nM R 3 with increasing concentrations of VEGF. The VEGF concentrations used were 0 nM, 5.9 nM, 12 nM, 23 nM, 94 nM, 375 nM, and 750 nM from the top to the bottom. The major peak was the unbound aptamer, and the minor peak indicated by the arrow was the VEGF-R3 complex. (b) The binding curve obtained from ACE experiments. (c) The binding curve obtained from FP experiments performed using the same samples. In (b) and (c) error bars report the standard deviation of three replicate measurements, and the errors of Kd represent the 95% confidence level.

