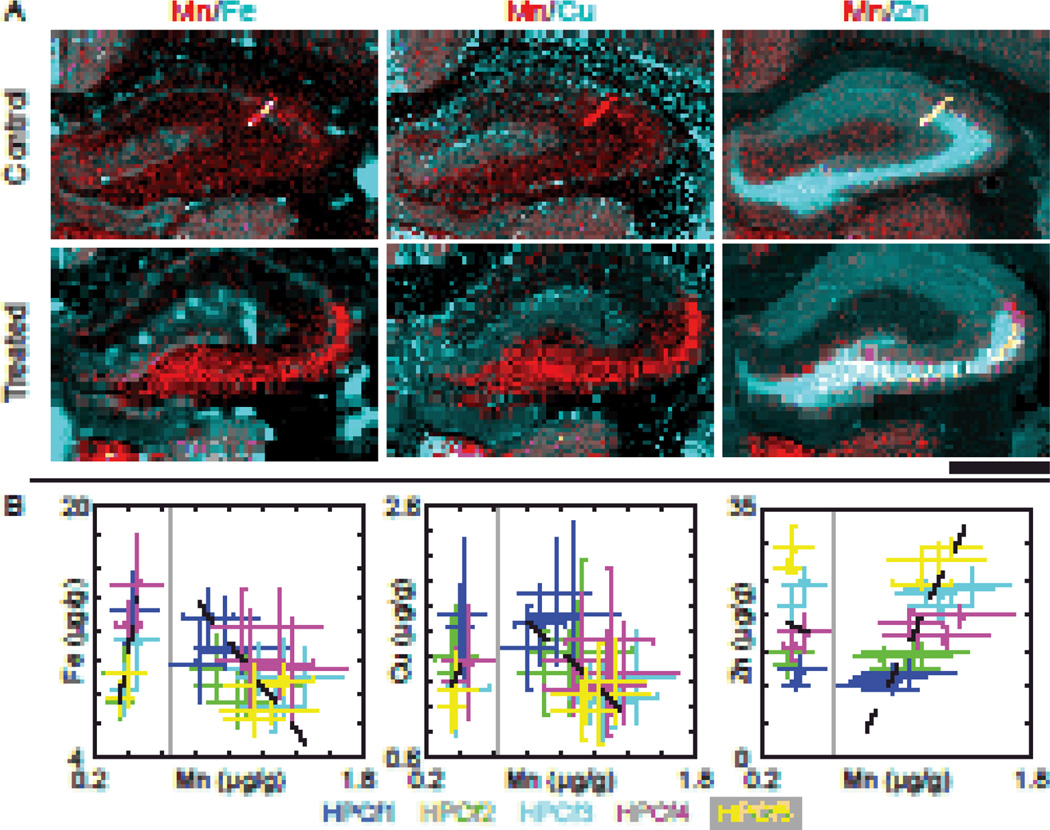
Fig. 2. Analysis of the hippocampal formation regions.
(A) Two colored images displaying Fe/Mn, Cu/Mn, and Zn/Mn respectively. Note that Mn and Zn strongly co-localize in the CA3 of the HPCf, while a small portion of Mn also co-localizes with Fe within the DG as indicated by white pixels in the images. Scale bar represents a length of 1 mm. (B) Scatter plots of the mean concentrations of regions identified by clustering. Points are color-matched to the regions specified in Fig. 1B and bars indicate the standard deviation for the given data points. Data points from control/treated samples are to the left/right of the vertical grey line respectively; n = 2/4 animals (control/treated) for HPCf 1&2, and n = 2/3 for HPCf 3–5. One treated animal was measured at both Bregma locations. Linear fit parameters and respective Pearson’s correlation coefficients are given in Table 3. Fits were weighted according to the variance of the data points. All numbers are given in µg/g.

