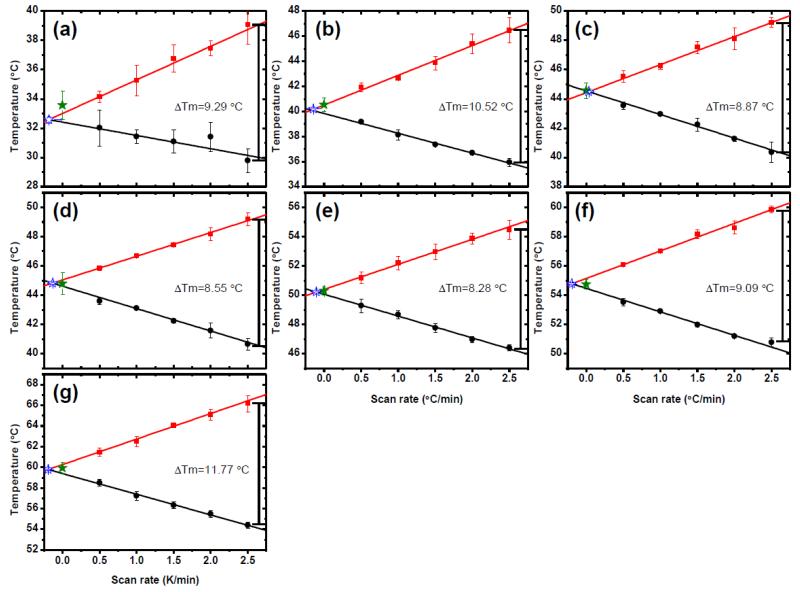
Fig. 3. Scan rate dependence of thermal unfolding/refolding.
(a) AL-103 H92D, (b) AL-103, (c) AL-103 P100Q, (d) AL-103 H92D-I34N, (e) AL-103 I34N, (f) κI O18/O8 and (g) AL-103 del95aIns. Apparent Tm values calculated from unfolding experiments are shown in red, those corresponding to refolding experiments are shown in black. ΔTm was calculated as the difference between the apparent Tm from the unfolding transition- apparent Tm from the refolding transition from the fastest scan rate values for each protein. Tm values obtained from kinetic model analysis (filled star) are in agreement with values obtained from model-free analysis (open star) within the error. Continuous lines represent the best fit to a straight line (n=30).

