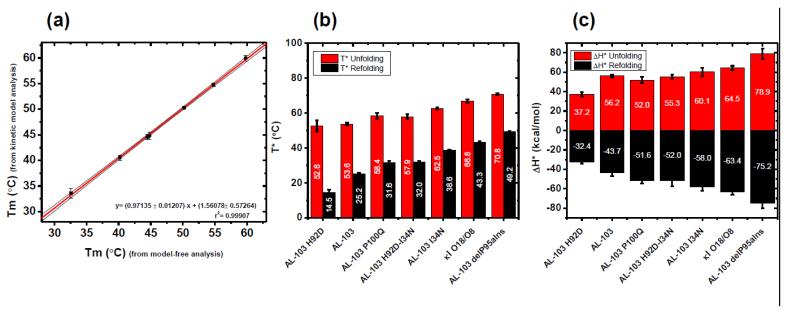
Fig. 4. Contribution of restorative mutants to the kinetic stability.
(a) Correlation between Tm estimate from the model-free analysis and the Tm values obtained from kinetic two-state model. Continuous lines represent the best fitting. The 95% confidence interval is shown in black thin lines. (b) T* and (c) ΔH‡ values for each protein characterized in this study. Labels in the bars show the average value (n=30). Values derived from unfolding experiments are shown in red, values from refolding experiments are shown in black.

