Figure 6.
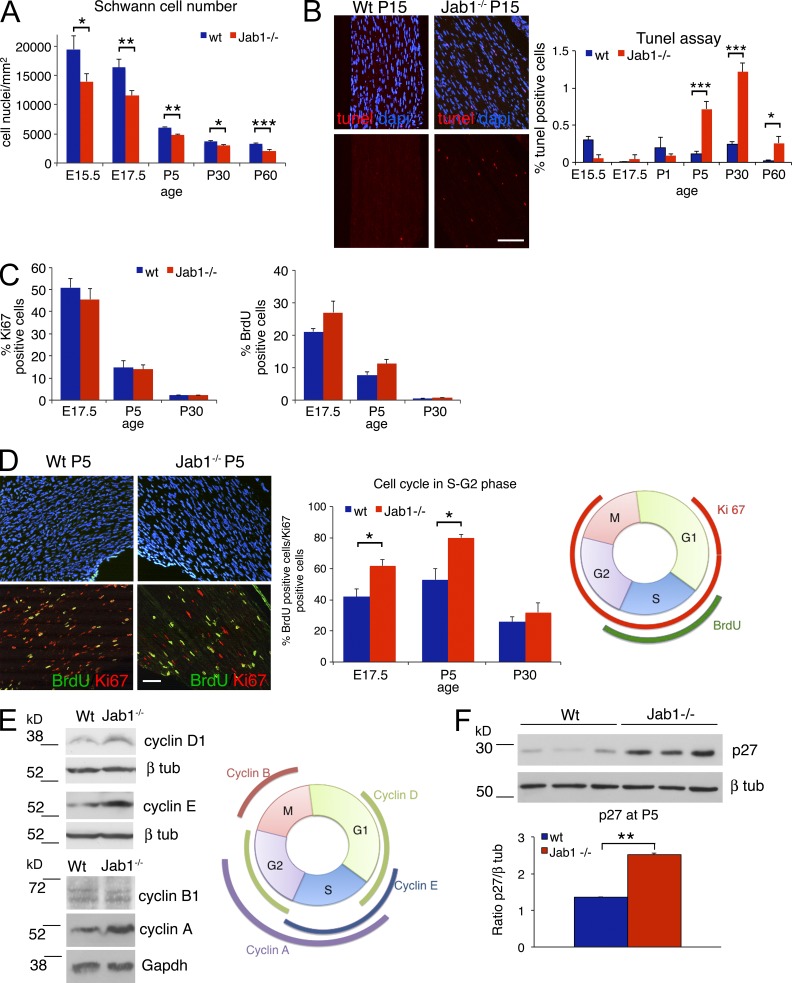
Schwann cells in mutant nerves are reduced in number and defective in cell cycle progression. (A) Quantification of Schwann cell number (S100 positive) in sciatic nerves of WT and Jab1−/− mice from E15.5 to P60 (n = 3 mice per genotype per time point). (B) Quantification of TUNEL-positive cells in sciatic nerve sections of WT and Jab1−/− mice from E15.5 to P60 (n = 4 mice per genotype per time point); immunofluorescence for TUNEL staining at P15 is shown as a representative image. (C) Quantification of Ki67- or BrdU-positive Schwann cells in sciatic nerves of WT and Jab1−/− mice at different time points (n = 3 mice per genotype). (D) Immunofluorescence representative for DAPI, BrdU, and Ki67 staining in sciatic nerves of WT and Jab1−/− mice at P5. The percentage of double-positive nuclei (BrdU/Ki67) on the total of Ki67-positive nuclei is quantified at E17.5, P5, and P30 (n = 3 mice per genotype per time point). A schematic representation of the cell cycle and phases marked by Ki67 and BrdU staining are shown on the right. (E) Western blot for cyclin levels in sciatic nerve homogenate of P5 WT and Jab1−/− mice. Each lane is a pool of 5 sciatic nerves for cyclin D1 and E or 10 sciatic nerves for cyclin B1 and A. The image is representative of two independent experiments. A schematic representation of cyclin expression in the different phases of cell cycle. (F) Western blot for p27 in sciatic nerve homogenate of P5 WT and Jab1−/− mice. Quantification is reported as the mean of three different mice per genotype and represented as ratio p27/β-tubulin. Paired Student’s t test: *, P ≤ 0.05; **, P ≤ 0.01; ***, P ≤ 0.001. Error bars indicate SEM. Bars: (B) 50 µm; (D) 30 µm.

