Figure 2.
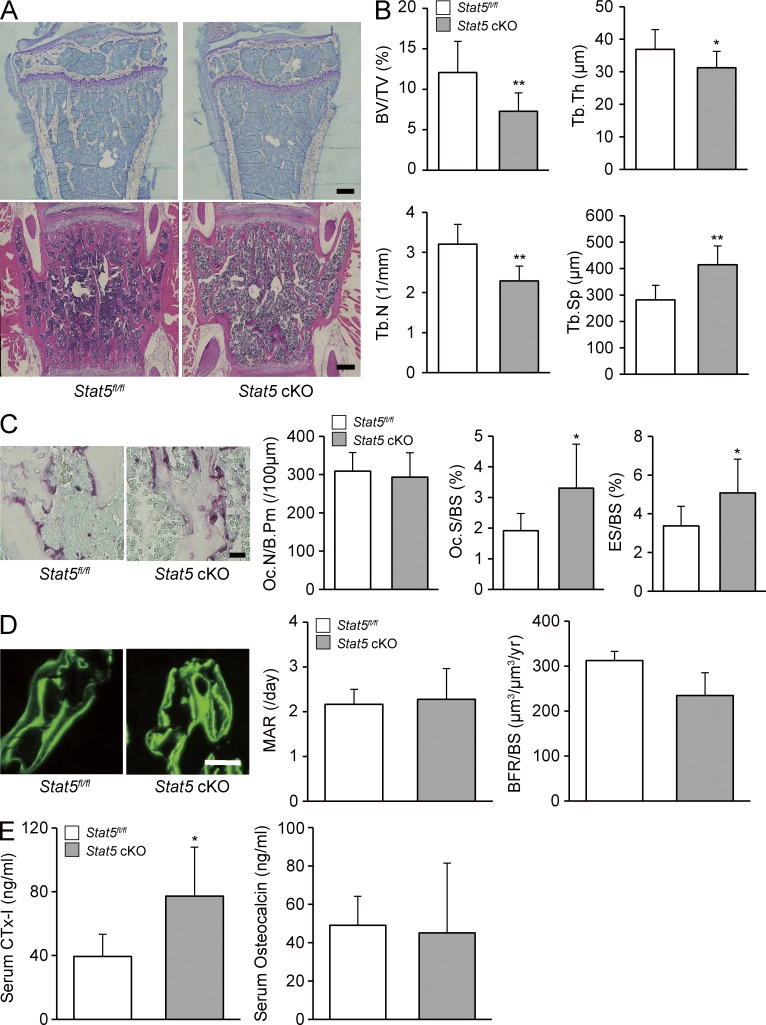
Bone resorption was promoted in Stat5 cKO mice. (A) Undecalcified sections of the proximal tibia (top) or decalcified section of the lumbar spine (bottom) from 8-wk-old Stat5fl/fl male mice (left) or Stat5 cKO male mice (right) were stained with toluidine blue (top) or H&E (bottom). Representative images from three mice/group are shown. (B) Histomorphometric analyses were performed on 8-wk-old Stat5fl/fl male mice and Stat5 cKO male mice. BV/TV, bone volume per total volume; Tb.Th, trabecular thickness; Tb.N, trabecular number; Tb.Sp, trabecular separation. Data are represented as the mean ± SD (*, P < 0.05; **, P < 0.01; n = 6). (C) TRAP expression in tibia from Stat5fl/fl (left) or Stat5 cKO mice (right) was assessed by TRAP staining and the following parameters were measured: Oc.N/B.Pm, osteoclast number per bone perimeter; Oc.S/BS, osteoclast surface per bone surface; ES/BS, eroded surface per bone surface. Data are represented as the mean ± SD (*, P < 0.05; n = 6). (D) Dynamic histomorphometric analysis of Stat5fl/fl and Stat5 cKO mice was performed after mice were injected subcutaneously with 16 mg/kg body weight of calcein at −3 and −1 d before sacrifice. Graphs show MAR, mineral apposition rate; BFR/BS, bone formation rate per bone surface. Data are represented as the mean ± SD (n = 6). (E) Serum concentration of CTx-I and osteocalcin in Stat5fl/fl mice and Stat5 cKO mice was assessed by ELISA. Data are represented as the mean ± SD (*, P < 0.05; n = 4/group). Bars: (A and D) 100 µm; (C) 25 µm.

