Figure 5.
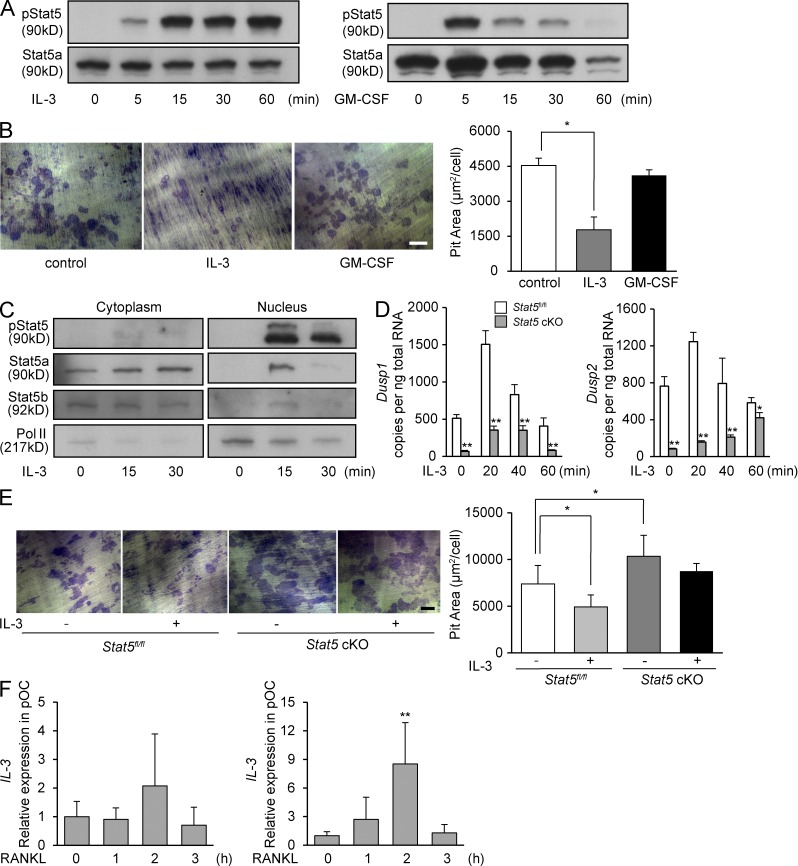
IL-3 may be a stimulator of Stat5 in osteoclasts. (A) WT osteoclasts were stimulated with IL-3 or GM-CSF, and whole-cell lysates were subjected to Western blotting using antibodies against phospho-Stat5 and Stat5a. (B) WT osteoclasts were cultured on dentin slices for 24 h with or without IL-3 and GM-CSF, and the resorption areas were visualized by toluidine blue staining and measured using an image analysis system. Representative resorption pits are shown (left). Graph shows pit resorption area per osteoclast (right). Data are represented as the mean ± SD (*, P < 0.05; n = 3). (C) Osteoclasts from WT mice were stimulated with IL-3 after serum starvation, and cytoplasmic and nuclear fractions were subjected to Western blotting using antibodies against phospho-Stat5, Stat5a, Stat5b, and RNA polymerase II. (D) Osteoclasts from Stat5fl/fl and Stat5 cKO mice were stimulated with IL-3 after serum starvation, and total RNA was extracted. The expression of Dusp1 (left) and Dusp2 (right) was analyzed by quantitative real-time PCR. Data are represented as the mean ± SD (*, P < 0.05; **, P < 0.01; n = 3/group). (E) Stat5fl/fl or Stat5 cKO osteoclasts were cultured on dentin slices for 24 h with or without IL-3, and the resorption areas were visualized by toluidine blue staining and measured using an image analysis system. Representative resorption pits are shown (left). Graph shows pit resorption area per osteoclast (right). Data are represented as the mean ± SD (*, P < 0.05). (B and E) Bars, 100 µm. (F) WT osteoclast precursors and osteoclasts were stimulated with RANKL for the indicated time, total RNA was prepared, and the expression of IL-3 was analyzed by quantitative real-time PCR. Data are represented as the mean ± SD (**, P < 0.01 vs. 0 h; n = 3). Results in all panels are representative of two independent experiments.

