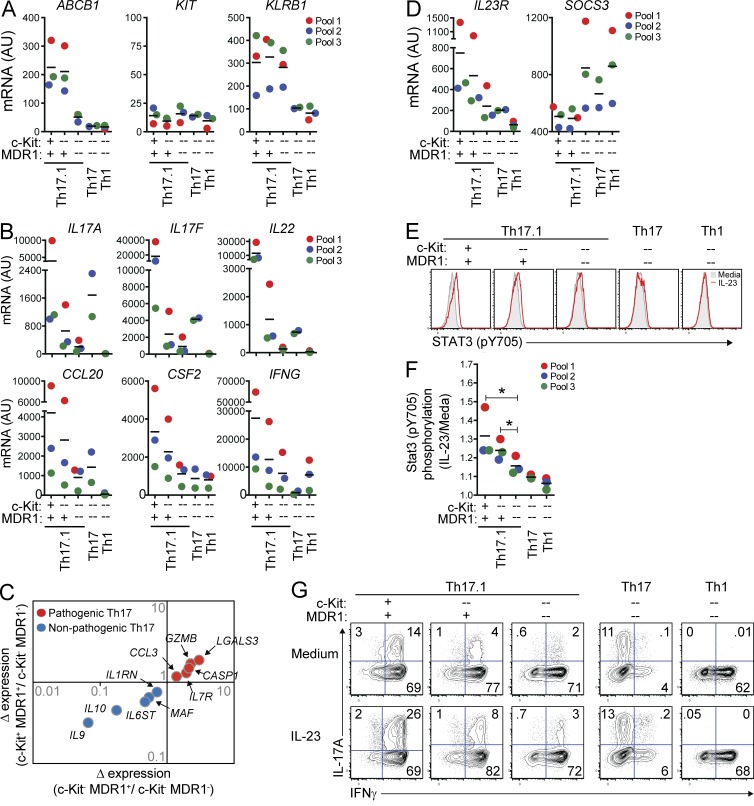
Figure 3.
Unique pro-inflammatory characteristics of human MDR1+ Th17.1 cells. (A and B) Human CD4+ memory T cells from pooled healthy adult donor peripheral blood were FACS-sorted into TEM (CCR7lo) Th17.1 (CCR6+CCR4loCXCR3hi), Th17 (CCR6+CCR4hiCXCR3lo), or Th1 (CCR6−CCR4loCXCR3hi) cells. Th17.1 cells were sub-sorted into c-Kit+ or c-Kit− MDR1+ (Rh123lo), or c-Kit−MDR1− (Rh123hi) cells as indicated; Th17 and Th1 cells were sorted as c-Kit−MDR1− cells (see Fig. S1 for gating/sorting strategy). All cells were stimulated with anti-CD3/anti-CD28 for 72 h and expression of ABCB1 (MDR1), KIT (c-Kit), and KLRB1 (CD161; A), or IL17A, IL17F, IL22, CCL20, CSF2 (GM-CSF), and IFNG (B) was determined by nanostring. Data are shown as individual (color-coded) and mean normalized raw expression values (AU, arbitrary units) in cells sorted from 2–3 independent donor pools, with each pool containing blood from 2–4 individual donors. (C) Expression of pathogenic (red dots) or nonpathogenic (blue dots) murine Th17-signature genes (Lee et al., 2012) in TEM c-Kit+MDR1+, c-Kit−MDR1+, or c-Kit−MDR1− Th17.1 cells was determined by nanostring as in A and B. Mean normalized raw expression values from 3 independent experiments performed on different donor pools containing blood from 2–4 individual donors were used for fold change calculations. (D) Expression of IL23R and SOCS3 mRNA was determined in human TEM subsets by nanostring as in A and B. (E) FACS-sorted TEM subsets from healthy donor peripheral blood (as in A and B) were stimulated with anti-CD3/anti-CD28 and cultured for 3 d with or without IL-23. Stat3 phosphorylation (pY705) was determined on day 3 by phospho-intracellular staining and FACS analysis. Gray filled histograms, media alone; red traced histograms, plus IL-23. Representative FACS plots are shown and represent 3 independent experiments using cells isolated from different donor pools, with each pool containing blood from 2–4 individual donors. (F) Stat3 phosphorylation was determined by flow cytometry in TEM subsets cultured with or without IL-23 for 3 d as in E. Data are shown as mean fold change in Stat3 pY705 MFI (IL-23/media alone) ± SD from 3 experiments using cells isolated from different (color-coded) donor pools. *, P < 0.05 by paired Student’s t test. (G) FACS-sorted TEM subsets from healthy donor peripheral blood were stimulated with anti-CD3/anti-CD28 and cultured for 6 d with or without IL-23. On day 6, cells were restimulated with PMA and ionomycin and IL-17A and IFN-γ expression was determined by intracellular cytokine staining and FACS analysis. FACS plots shown are representative of 3 experiments using cells sorted from different donor pools, with each pool containing blood from 2–4 individual donors. Horizontal bars represent the mean values.

