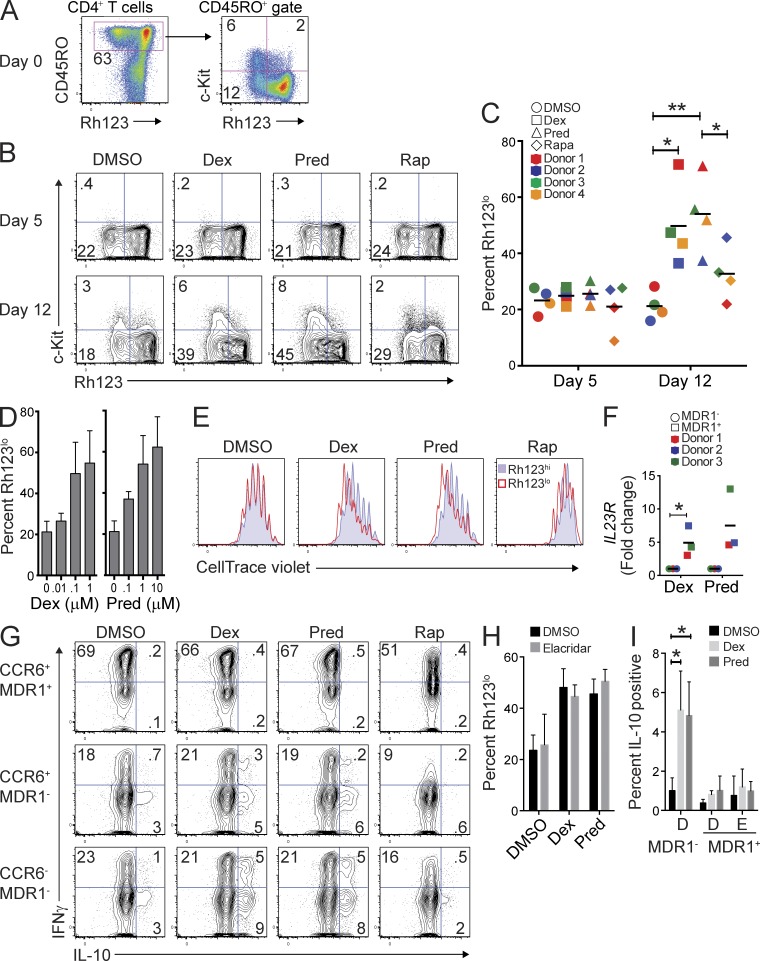
Figure 5.
MDR1+ Th17.1 cells are refractory to glucocorticoid-mediated T cell suppression. (A) Total CD4+ T cells from healthy donor peripheral blood were labeled with Rh123, stained for CD45RO and c-Kit expression after Rh123 efflux, and analyzed for the frequency of c-Kit+ and c-Kit− MDR1+ (Rh123lo) memory T cells ex vivo (day 0) by flow cytometry. FACS plots show MDR1 (Rh123 efflux) activity versus CD45RO (left) or c-Kit (right) expression. Data represent 4 experiments on individual donors. (B) Total CD4+ T cells were stimulated with anti-CD3/anti-CD28 and were cultured for 5 d (top) or 12 d (bottom) in the presence of DMSO (vehicle), dexamethasone (Dex; 0.1 µM), prednisolone (Pred; 1 µM), or rapamycin (Rap; 0.1 µM). At days 5 and 12, cells were analyzed by FACS for Rh123 efflux and c-Kit expression as in A. FACS plots shown are representative of 4 experiments on individual donors. (C) Percentage of Rh123lo (MDR1+) cells within total CD4+ T cells cultured for 5 or 12 d with DMSO, Dex, Pred, or Rap was determined by FACS analysis as in B. Data are shown as individual (color coded) and mean percentages of Rh123lo cells from 4 independent donors. *, P < 0.05; **, P < 0.01 by paired Student’s t test. Horizontal bars represent the mean values. (D) Total CD4+ T cells were stimulated with anti-CD3/anti-CD28 and treated with titrating concentrations of dexamethasone (Dex; left) or prednisolone (Pred; right). At day 12, the frequency of Rh123lo cells was determined by Rh123 efflux and FACS analysis. Data are shown as mean percentages of Rh123lo (MDR1+) T cells ± SD from 4 independent experiments performed on cells from different donors. (E) Total CD4+ T cells were labeled with CellTrace violet, stimulated with anti-CD3/anti-CD28, and treated with DMSO, Dex, Pred, or Rap as in B. On day 5, cells were further labeled with Rh123 and were analyzed for Rh123 efflux and CellTrace violet dilution by FACS analysis. Overlaid histograms show CellTrace violet dilution in T cells gated as MDR1+/Rh123lo (red histogram) or MDR1−/Rh123hi (blue histogram); data represent 4 experiments performed on T cells isolated from individual donors. (F) Total CD4+ T cells were stimulated with anti-CD3/anti-CD28, treated with dexamethasone (Dex; 0.1 µM) or prednisolone (Pred; 1 µM), and cultured for 12–14 d. Cells were then loaded with Rh123, FACS-sorted into MDR1+/Rh123lo and MDR1−/Rh123hi cells, and RNA was isolated to determine IL23R gene expression by qPCR. Expression of IL23R was normalized to ACTB (β-actin). Data are shown as relative (fold change) IL23R expression in MDR1+ (Rh123lo) and MDR1− (Rh123hi) T cells sorted from Dex- or Pred-treated cultures. Individual (color-coded) and mean values are shown for 3 experiments performed on cells from different donors. *, P < 0.05 by paired Student’s t test. Horizontal bars represent the mean values. (G) FACS-sorted CCR6+MDR1+/Rh123lo, CCR6+MDR1−/Rh123hi, or CCR6−MDR1−/Rh123hi cells were stimulated with anti-CD3/anti-CD28, treated with DMSO, dexamethasone (Dex; 0.1 µM), prednisolone (Pred; 1 µM), or rapamycin (Rap; 0.1 µM), and cultured for 5 d. Cells were restimulated with PMA and ionomycin, and IFN-γ and IL-10 expression was determined by intracellular staining and flow cytometry. FACS plots are representative of 4 experiments using cells sorted from individual donors. (H) Total CD4+ T cells were stimulated with anti-CD3/anti-CD28, treated with DMSO, dexamethasone (Dex; 0.1 µM), or prednisolone (Pred; 1 µM), in the absence (DMSO) or presence of elacridar (0.1 µM). Cells were cultured for 12 d and were then analyzed for Rh123 efflux by FACS as in A, B, and D. Data are shown as percentage of MDR1+/Rh123lo T cells ± SD from 3 independent experiments using cells from different donors. (I) FACS-sorted MDR1− or MDR1+ (CCR6+) cells were stimulated with anti-CD3/anti-CD28 and cultured in the absence (DMSO) or presence of dexamethasone (Dex; 0.1 µM), or prednisolone (Pred; 1 µM) plus vehicle (DMSO; D) or 0.1 µM elacridar (E) for 5 d. Cells were restimulated with PMA and ionomycin, and IL-10 expression was determined by intracellular cytokine staining and FACS analysis. Data are shown as mean percentages of IL-10–expressing cells ± SD from 3 donors. *, P < 0.05 by paired Student’s t test.

