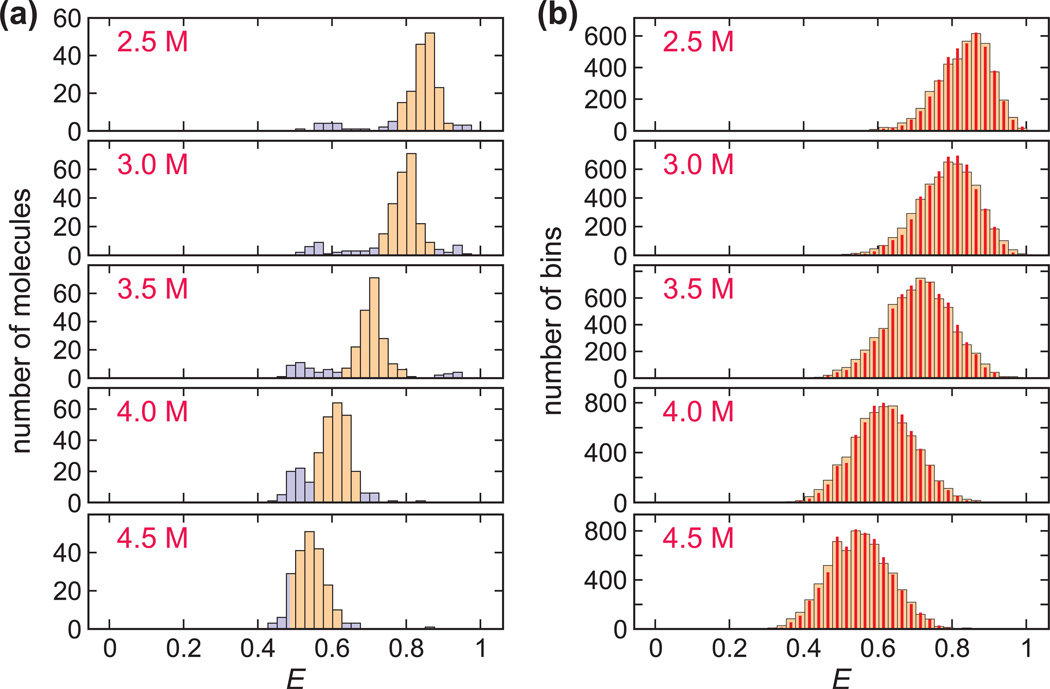
Fig. 4.
FRET efficiency histograms at various GdmCl concentrations. (a) The FRET efficiency histograms were obtained from the FRET efficiencies calculated for the first segment in each trajectory until either a bleach or a blink. Although a very narrow unimodal distribution is expected at each concentration due to the fast folding-unfolding compared to 0.5 ms bin time, an additional distribution appears at E ~ 0.5 colored in light blue. The trajectories with FRET efficiencies within the specific range (colored in orange) at each GdmCl concentration were used in plot (b) and analyzed further. These ranges are: 0.775 < E < 0.925 (2.5 M); 0.725 < E < 0.875 (3 M) ; 0.625 < E < 0.8 (3.5 M) ; 0.55 < E < 0.675 (4 M) ; 0.485 < E < 0.625 (4.5 M). (b) The FRET efficiency histograms (wide bars) were constructed from the FRET efficiencies of individual 0.5 ms bins of segments in the main distribution (orange) in (a) with the mean photon count rate > 75 ms−1. The histograms constructed from re-colored photon trajectories (red narrow bars) using the parameters obtained from the maximum likelihood method (4-state kinetic model) coincide extremely well with the experimental histograms.

