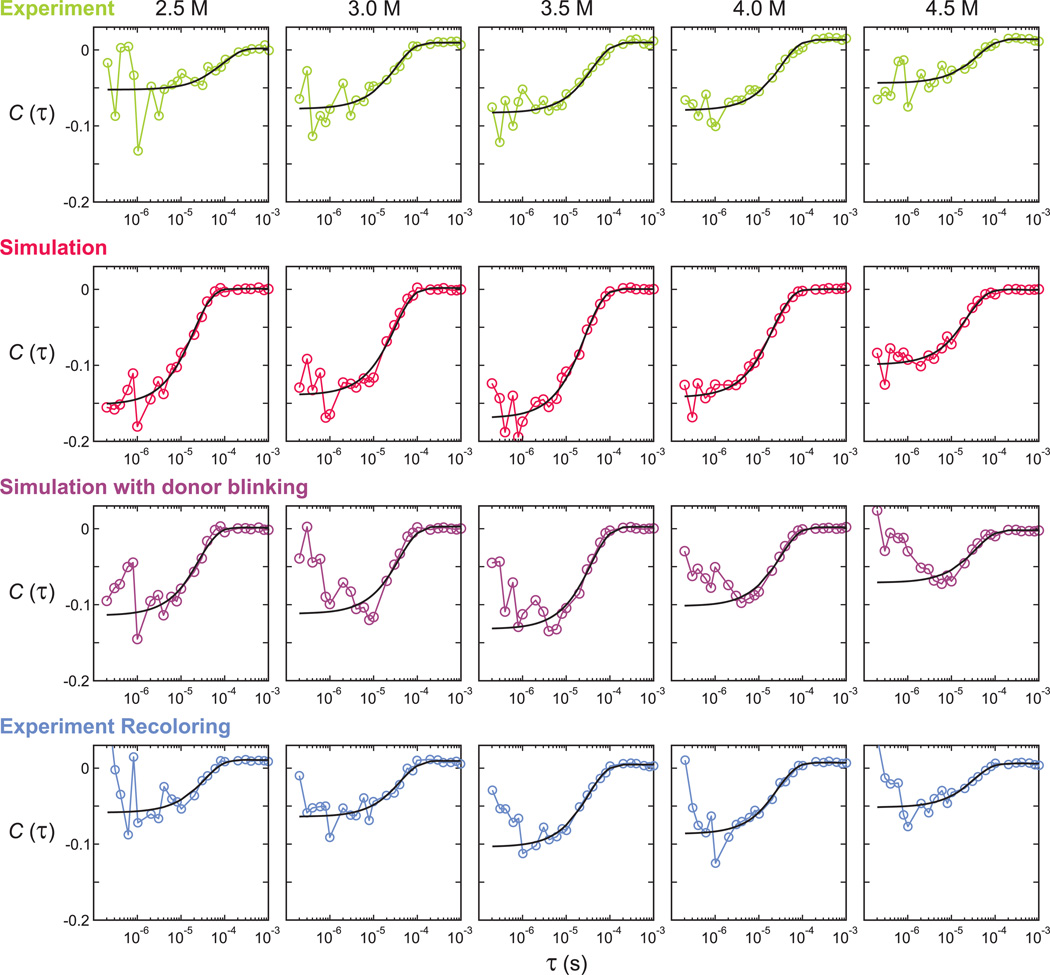
Fig. 6.
Donor-acceptor cross-correlation functions calculated from the experimental data (first row), simulated photon trajectories using 2-state kinetic model maximum likelihood parameters without (second row) and with (third row) donor blinking, and re-colored experimental trajectories using the 4-state kinetic model that includes acceptor blinking (bottom row). Black solid lines are exponential fitting curves and the fitting parameters are listed in Table 1 and 2. The decay time ranges in the fitting were either 400 ns 1 ms (first and second row) or 2 s 1 ms (third and bottom row).

