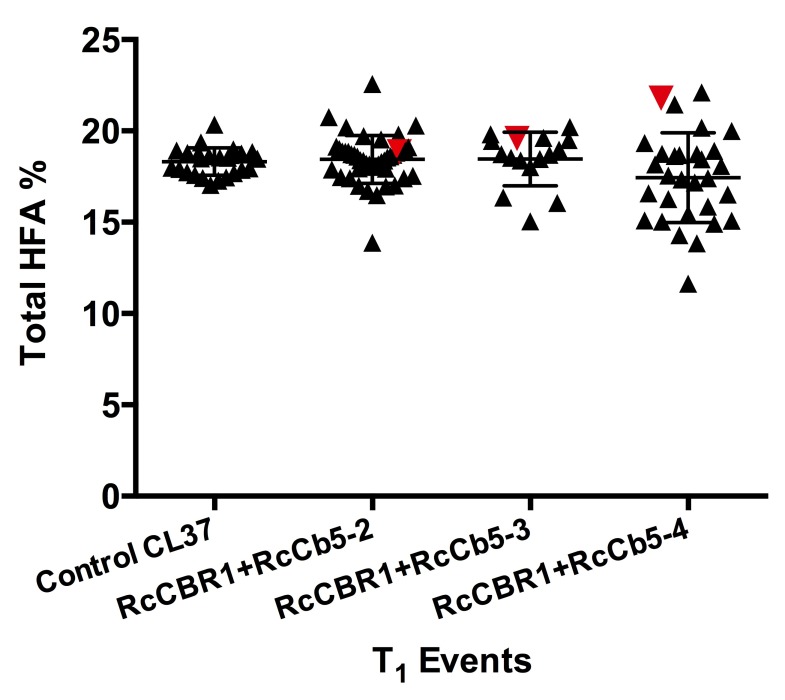
Figure 5. Total HFA accumulation in seed of individual RcCBR1+RcCb5 CL37 primary transformants.
Total HFA (18:1-OH+18:2-OH) contents of mature T 2 seeds from individual transformants expressing RcCBR1+RcCb5-2, RcCBR1+RcCb5-3 or RcCBR1+RcCb5-4 in the CL37 line. Results are compared with untransformed CL37 controls grown alongside T 1 plants. Red inverse triangles indicate events that were further analyzed. Error bars represent standard deviation; n=25 for control CL37, n=45 for RcCBR1+RcCb5-2, n=16 for RcCBR1+RcCb5-3, and n=30 for RcCBR1+RcCb5-4.

