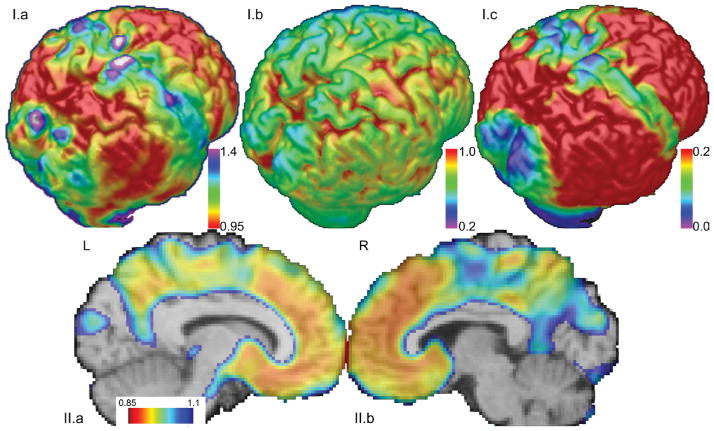
Figure 2. Shown are surface maps of estimated inflection point, initial signal intensity, and accumulation.
(I.a) The inflection point at which the voxel-wise PiB signal begins increasing estimates the pattern of progression of amyloid deposition. Higher cDVR needs to be reached before blue/green regions are affected. The occipital and sensorimotor cortices are relatively spared. Units are in total amyloid burden (cDVR) at which the signal begins increasing at a particular voxel. (I.b) The initial signal intensity has no apparent pattern of sparing. This suggests that the spatial patterns for the IPM and accumulation maps are due to amyloid signal increase. (I.c) The amount of amyloid accumulation may be reflected via integration of the curve after the inflection point. Relatively spared areas are similar to those found via spatial analysis of the inflection point, i.e., the sensorimotor and occipital cortices. Units are signal intensity increase multiplied by cDVR. (II) Both the precuneus and frontal regions are affected early, i.e., for low cDVR values. A map of inflection points along the sagittal midline shows that the precuneus and frontal regions begin accumulating amyloid when the total amyloid burden is relatively low.

