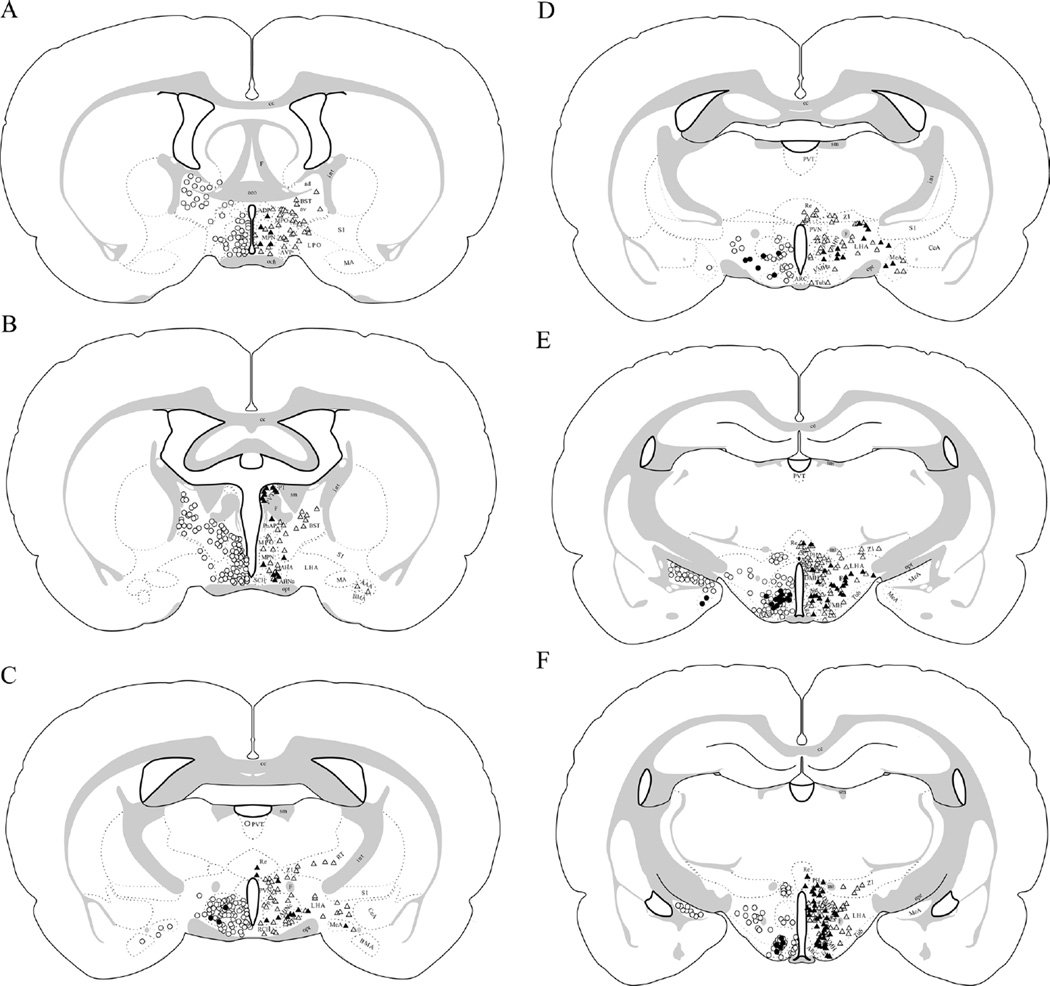
Figure 3.
FG injections into the anterior versus posterior PVN and its surround reveal differing extents of VGluT2 mRNA colocalization in PVN-projecting brain regions. Case 110 (anterior-to-mid PVN injection) is shown on the left side of the brain illustrations (open circles denote cells that are positive for FG only, whereas filled circles denote cells that are dual positive for FG and VGluT2 mRNA). Case 102 (posterior-to-mid PVN injection) is shown on the right side of the brain illustrations (open triangles denote cells that are positive for FG only, whereas filled triangles denote cells that are dual positive for FG and VGluT2 mRNA). A: ≈Bregma −0.4 mm. B: ≈Bregma −0.5 mm. C: ≈Bregma −1.55 mm. D: ≈Bregma −1.8 mm. E: ≈Bregma −2.8 mm. F: ≈Bregma −3.3 mm. Approximate cell locations were mapped onto schematics modified from the Swanson atlas (1998).

