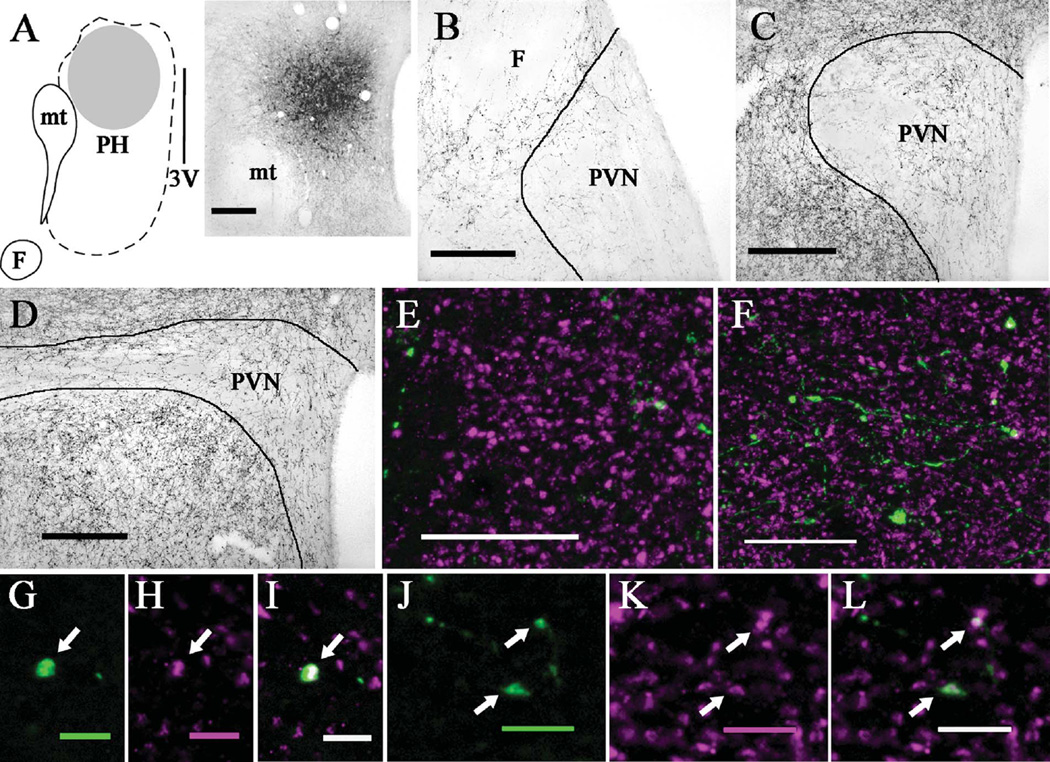
Figure 5.
PhaL injections into the posterior hypothalamic nucleus produced more anterogradely labeled fibers in the posterior than anterior PVN. A: Diagram (left) and brightfield image (right) depicting the location of a PhaL injection site in the posterior nucleus (case 8; ≈bregma −3.8 mm). B: Brightfield image shows few PhaL-positive fibers and boutons in the anterior PVN (≈bregma −0.8 mm). C: At the evel of mid PVN (≈bregma −1.8 mm), many PhaL fibers and boutons are seen in the parvocellular subdivision with less in the magnocelular subdivision; the greatest density of PhaL-positive fibers occurs in the PVN surround. D: In the posterior PVN (≈bregma −2.1 mm), there are numerous PhaL-positive fibers and boutons throughout the PVN and an even greater fiber density in the PVN surround. Dual immunolabeling for PhaL (green) and VGluT2 (magenta) shows a lower density of PhaL-positive fibers and boutons in anterior (E) versus posterior (F) PVN, with relatively comparable levels of VGluT2 labeling (images are projections made from z-stack images). In the anterior PVN, higher magnification views of a single optical section (≈0.45 µ.m thick) show a rare PhaL-positive bouton (arrow; G) that is also positive for VGluT2 (arrow; H,I). In the posterior PVN, higher magnification views of a single optical section (≈0.45 µm thick) show two PhaLpositive boutons (arrows; J) that are also positive for VGluT2 (arrows; K,L; dual labeling appears white); dual-labeled boutons are much more commonly observed in the posterior versus anterior PVN. Diagram in (A) modified from Paxinos and Watson (1998). Scale bars = 200 µm for A–D; 20 µm for E,F; 5 µm for G–L.

