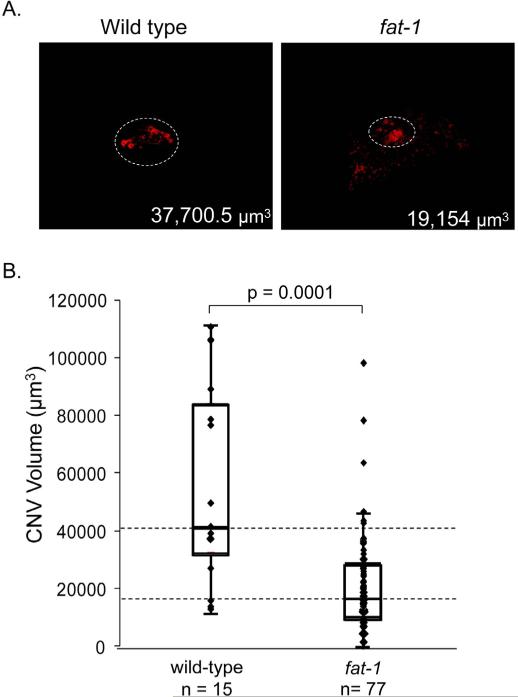
Figure 2.
Neovessel volumes from transgenic (fat-1) mice (A) Representative red channel projections (neovessels) from wild-type and fat-1 transgenics. Bottom right depicts lesion volumes. (B) Box and whisker representation: Neovessel volumes from transgenic mice that overproduce DHA (fat-1 mice), and wild type controls; n = number of lesions (17 animals for fat-1 mice and 4 animals for wild type mice). Fat-1 lesions were 59% smaller in volume than control lesions. All samples were quantified in μm3 using an image analysis module. Each point represents the mean value of a triplicate measurement. Dotted horizontal lines represent median values of neovessel volume for both conditions.

