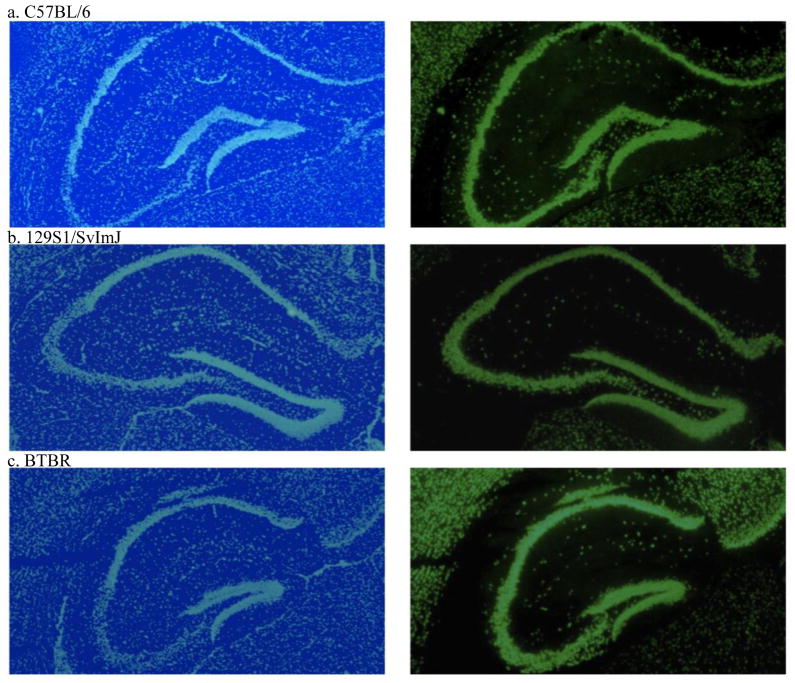
Figure 5. DAPI nuclear (left) and NeuN neuronal (right) staining in the adult mouse hippocampus.
(a) C57BL/6, (b) 129S1/SvImJ and (c) BTBR mouse hippocampi had similar cell (in light blue) and neuron (in light green) density in the dentate gyrus. Representative sections from each strain are shown. For interpretation of the references to color in the figure legend, the reader is referenced to the web version of this article.

