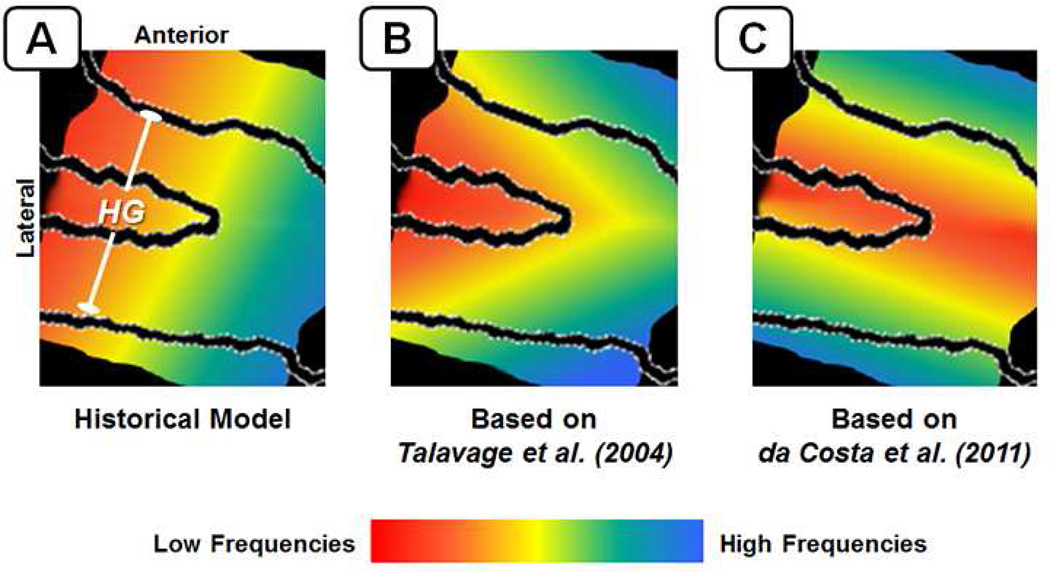
Figure 3.
Diagrams to illustrate change in understanding of the organization of frequency selectivity (i.e., tonotopy) in primary auditory areas, as brought about by the application of functional neuroimaging. (A) The historical literature proposed a low-to-high gradient of frequency selectivity running along the superior aspect of Heschl’s gyrus, from antero-lateral to postero-medial. (B) Early continuous mapping of frequency selectivity suggested two “mirrored” maps on Heschl’s gyrus, sharing a low-frequency selective area on the superior aspect, with high-frequency selective areas on the antero-medial and postero-medial faces of the gyrus (Talavage et al., 2000; Talavage et al., 2004b). (C) High-field (7T) mappings using advanced event-related fMRI experimentation reveal a more complex arrangement in the entirety of auditory cortex, with the finding that frequency selective gradients in the primary auditory areas run normal to the long axis of Heschl’s gyrus (Da Costa et al., 2011).

