
Fig. 1.
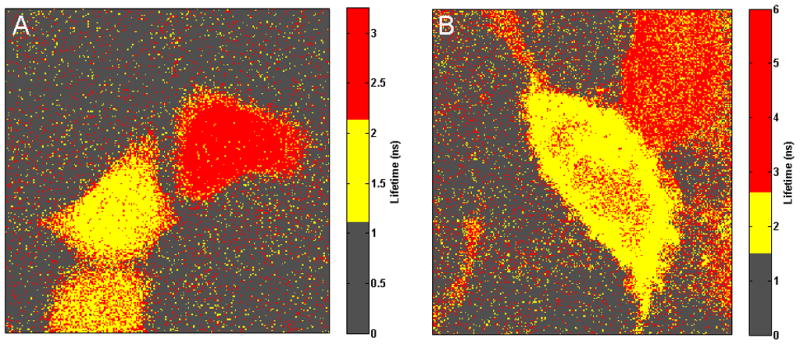
Fluorescence lifetime imaging microscopy images of live cells transfected with EGFP-RFP fusion Förster resonance energy transfer (FRET) protein pairs. False colors represent different segments. Images are depicted by carefully adjusting the respective colormaps. Color boundaries are specified based on the expected fluorescence lifetimes (FLT) in the FRET cell and the cell with no FRET. Ground-truths established based on these images are thus universal, and we used these images for evaluating the performance of the proposed segmentation method. (A–B) For the cells with EGFP-RFP fusion FRET pairs, two adjacent cells show distinct donor fluorescent lifetimes (FLTs). One of the cells is a FRET cell, and the other cell’s acceptor RFP was irreversibly bleached, leading to a FLT shift from the former.