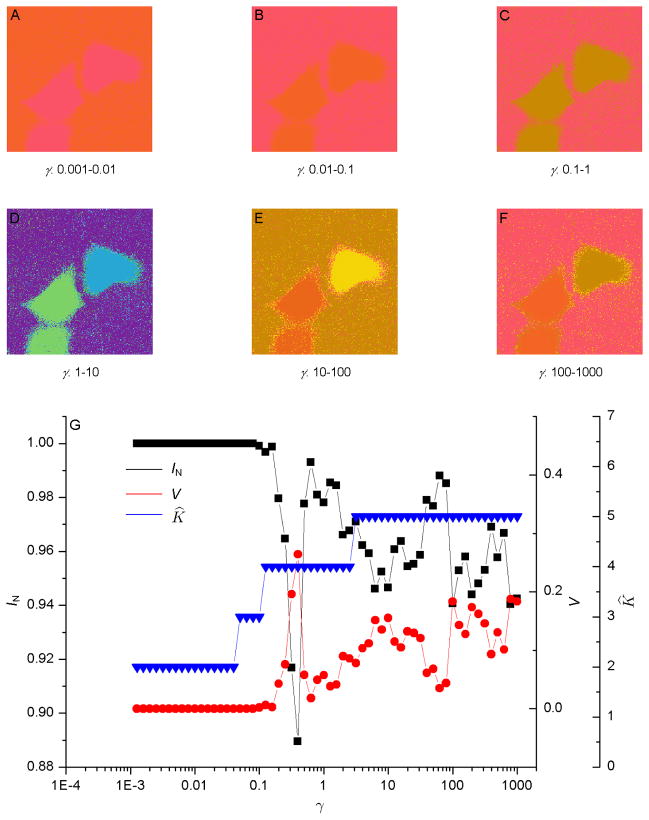
Fig. 2.
(A–F) Segmentation of the fluorescence lifetime imaging microscopy image shown in Fig. 1A using the multi-resolution community detection (MCD) method for increasing resolution. False colors represent different segments. For resolution parameter γ > 1, two major segments, one representing the Förster resonance energy transfer cell and the other representing the unquenched cell, are clearly visible. (G) Information theoretic overlaps between the replicas of the MCD method, such as their normalized mutual information IN and variation of information V, together with the number of estimated segments K̂ as a function of γ. Natural network resolutions correspond to the values of γ for which the replicas exhibit extrema and plateau in the average of their information theoretic overlaps.

