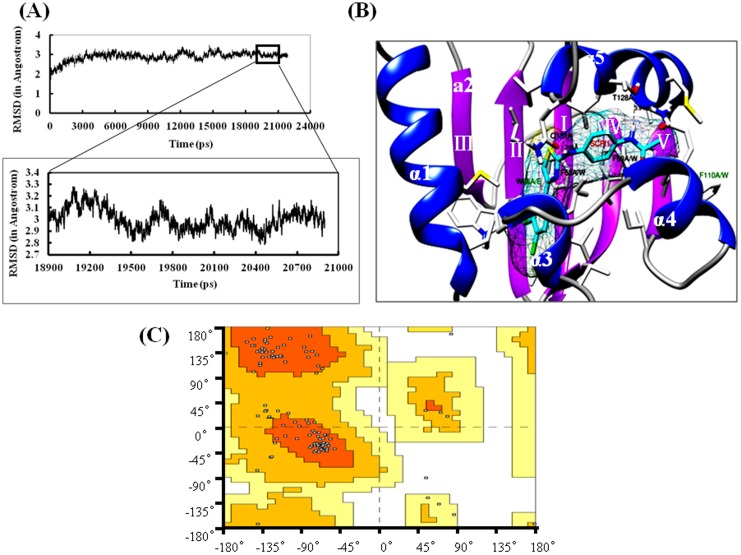
Figure 2. Modeling of SlSCPx-2 protein.
(A) Dynamics curve. Trajectories were recorded every 1ps during the entire MD simulation process. Each point represents a 3D-structure of SlSCPx-2/SCPI1. The final optimal structure SlSCPx-2/SCPI1 was an averaged conformation modeling derived from the trajectories of the converged 18900–20900 ps. (B) The final optimal structure of the SlSCPx-2/SCPI1 complex in a ribbon view. The α–helixes are shown in blue and the β–sheets are shown in pink. Selected amino acid residues that directly interact with the bound ligand (black colored sticks; F53, F89, T128, and Q131) and indirectly contact with the ligand (dark green colored stick; W66 and F110) were used for point mutation. The AeSCPI-1 is highlighted as stick model colored cyan. (C) The Ramachandran plot of the SlSCPx-2/SCPI1 complex. The orange color represents those residues in the most favored regions; The dark yellow represents those residues in the additionally allowed regions; The light yellow represents those residues in generously allowed regions; The white represents those residues in disallowed regions.

