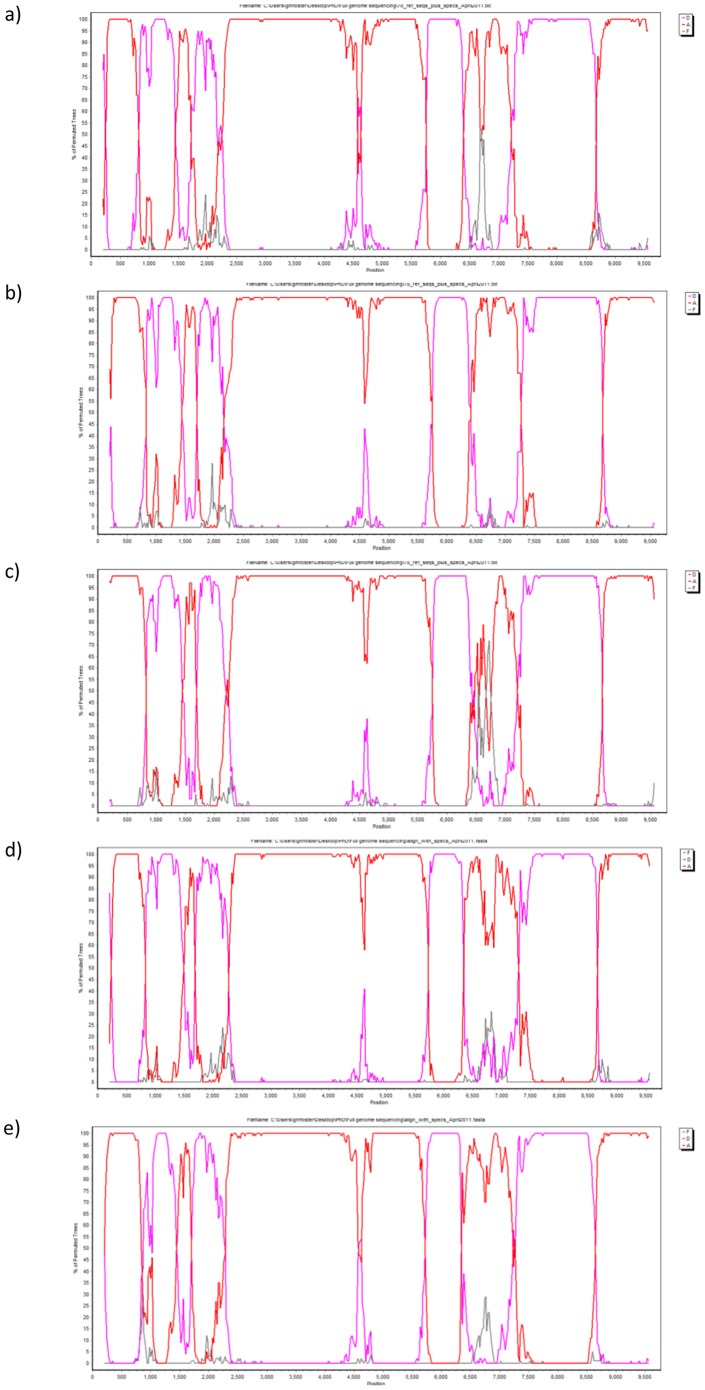
Figure 2. Bootscanning plots for five A1/D recombinants.
Bootscanning plots from Simplot sliding window analysis using a window size of 400(not HXB2 numbering). Subtype A is represented in red, subtype D in lavender, and subtype F (outgroup) in grey. All five specimens (33365, 8179, 40534, 11762, 12792) showed identical bootscanning plots, with five subtype A1 regions and four subtype D regions. A) Specimen 33365; b) Specimen 8179; c) Specimen 40534; d) Specimen 11762; e) Specimen 12792.

