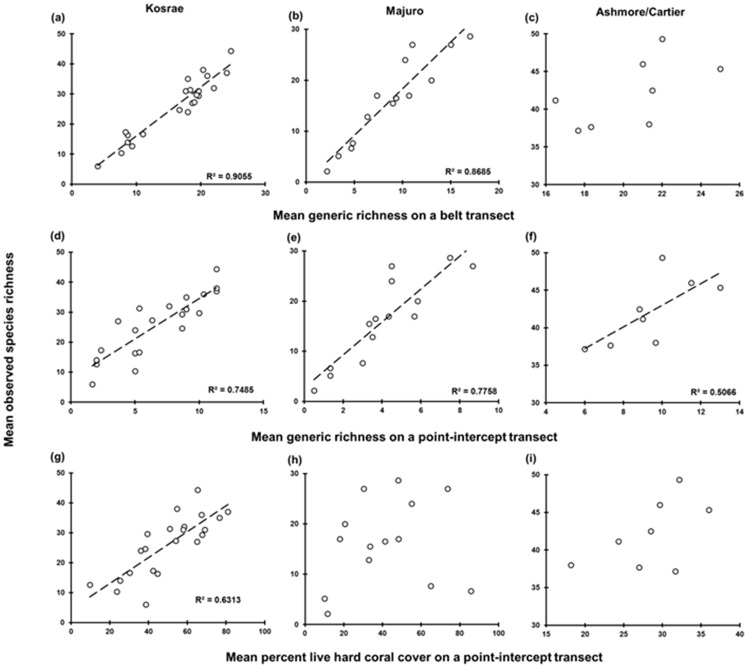
Figure 2. Site-level linear regressions of species richness on predictor variables (in rows) at the three locations (in columns).
The number of sites for each location is shown in Table 1. R2 and the 1∶1 relationship are shown for significant associations.

