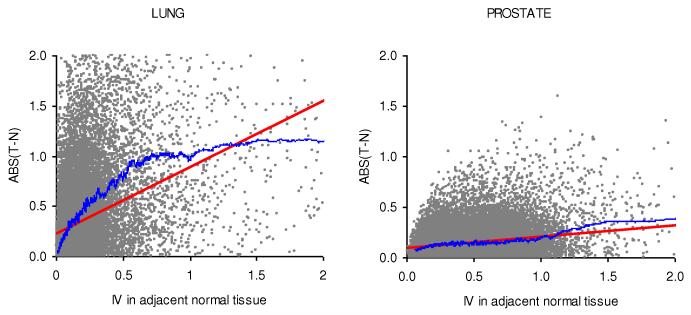
Figure 2.
An association between IV in adjacent normal tissue and absolute differences in the expression levels between normal tissue (N) and tumor (T). Each dot represents a probe. The red line is a linear regression curve, and the blue line is a moving average computed for the 250 closest probes in terms of variance. There is a positive correlation between IV and absolute differences in the expression levels between N and T in both lung (left) and prostate (right) cancers.

