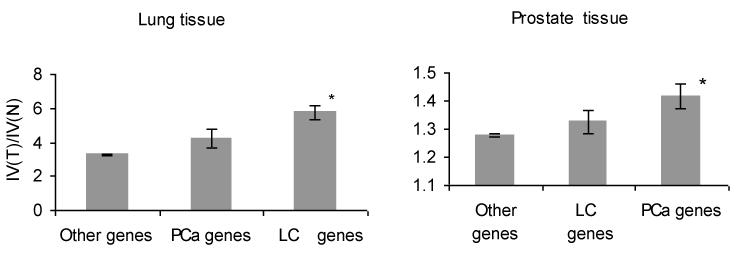
Figure 3.
Ratios of IVs between tumor and adjacent normal tissues: LC-related, PCa-related, and all other genes. Left panel shows lung, and the right panel shows prostate tissues. Note that the ratio for PCa genes in lung tissue seems to be slightly elevated, most likely due to overlap between PCa- and LC-related genes. The same is true for LC genes in prostate tissue.

