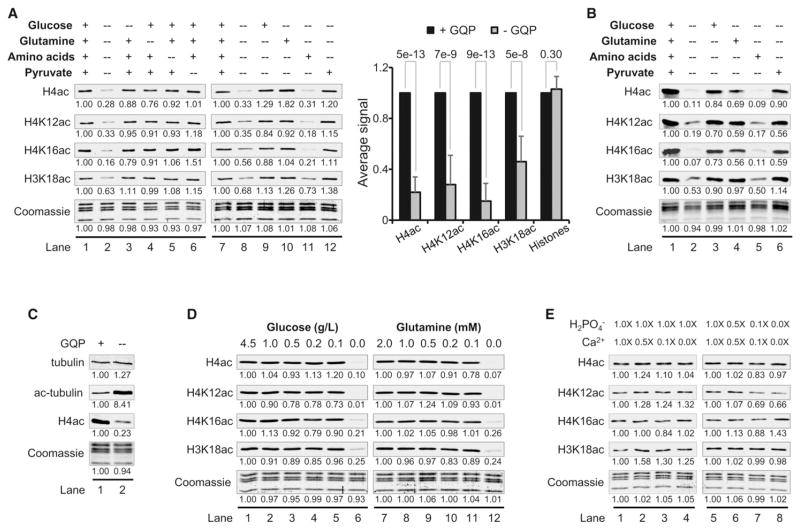
Figure 1. Minimal Levels of G, Q, or P Maintain Global Levels of Histone Acetylation.
(A) WBs of histone acetylation in HeLa cells cultured for 16 hr in DMEM salts and vitamins with the indicated ac-CoA sources. The bar graph shows average values ± SD from 15 independent experiments and p value derived from the Student’s t test.
(B) WBs of acetylation in normal IMR90 fibroblasts cultured as in (A).
(C) WBs of tubulin and histone H4 acetylation in HeLa cells under conditions of G, Q, and P deprivation.
(D) WBs of acetylation in HeLa cells cultured at the indicated concentrations of G or Q.
(E) WBs showing the effects of varying concentrations of Ca2+ and phosphate on histone acetylation in HeLa cells. Lane 1 in each panel (A–E) is the reference condition, the values of which are set to 1. See also Figure S1.

