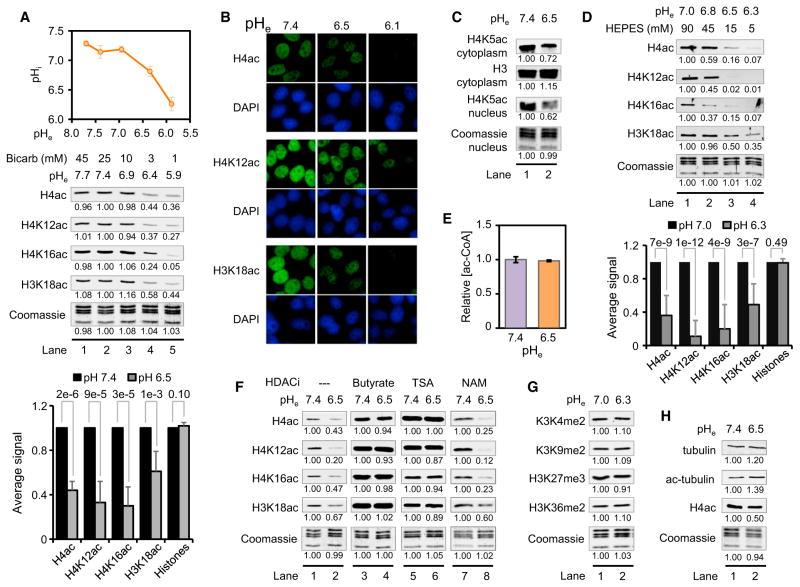
Figure 2. Global Levels of Histone Acetylation Decrease when pHi Decreases.
(A) Measurements of pHi (mean ± SD) as a function of pHe and effects on histone acetylation in HeLa cells cultured at the indicated pHe for 16 hr in complete DMEM as assessed by WB. The reference condition is set to 25 mM bicarbonate (lane 2), which approximates the normal physiological concentration. The bar graph shows average values ± SD from seven independent experiments and p value derived from the Student’s t test.
(B) Immunofluorescent analysis of histone acetylation of HeLa cells cultured as in (A).
(C) WB analysis of H4K5ac in HeLa cells in the indicated histone fractions and pH.
(D) WBs of histone acetylation in HeLa cells cultured in media buffered with HEPES. The bar graph shows average values ± SD from 17 independent experiments and p value derived from the Student’s t test.
(E) Acetyl-CoA measurements (mean ± SD) in HeLa cells treated for 4 hr at the indicated pHe.
(F) WBs of histone acetylation in HeLa cells that were treated with or without 5 mM sodium butyrate, 500 nM TSA, or 2 mM nicotinamide (NAM) for 6 hr in complete DMEM at pHe 7.4, followed by incubation at the indicated pHe for 4 hr.
(G) WBs of histone methylation in HeLa cells cultured at the indicated pH.
(H) WBs of tubulin and histone H4 acetylation in HeLa cells treated for 16 hr at the indicated pH values. See also Figure S2.

