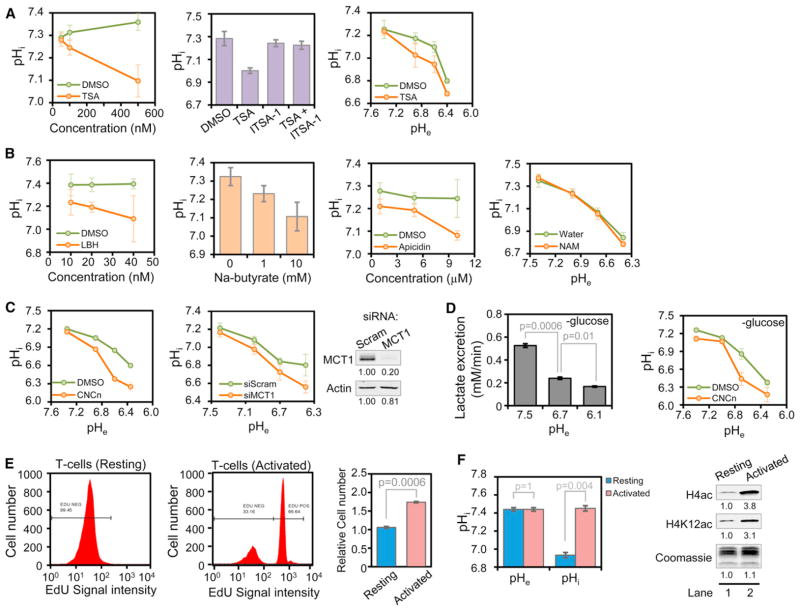
Figure 7. HDACs, MCTs, and Cellular Proliferation Affect pHi and Global Histone Acetylation Levels.
(A and B) pHi of HeLa cells treated in standard DMEM overnight with (A) the indicated concentration of TSA (left panel); 250 nM TSA, 50 μM ITSA-1, or both (middle panel); 100 nM TSA followed by 6 hr of culture at the pHe indicated (right panel); or (B) the listed HDAC inhibitors at the indicated concentrations (NAM = 2 mM nicotinamide).
(C) pHi of HeLa cells in which MCT function was inhibited by treatment for 1 hr with 10 mM CNCn (left panel) or by siRNA-mediated knockdown of MCT1 for 96 hr (right panel) followed by treatment for 30 min at the pHe shown.
(D) Rates of lactate excretion in HeLa cells after 30 min of treatment in DMEM without G and P at the indicated pHe (left panel); pHi measurements under identical conditions with 10 mM CNCn or DMSO (right panel).
(E) T cells were stimulated to proliferate by CD3/CD28-coated dynabeads and interleukin-2 treatment for 48 hr. EdU incorporation was determined by flow cytometry, and cell number was counted with and without 48 hr stimulation.
(F) pHe and pHi values, as well as histone acetylation, of resting and activated T cells after 48 hr. Note that pHi changes independently of pHe. All data (A–F) are presented as mean ± SD. See also Figure S6.

