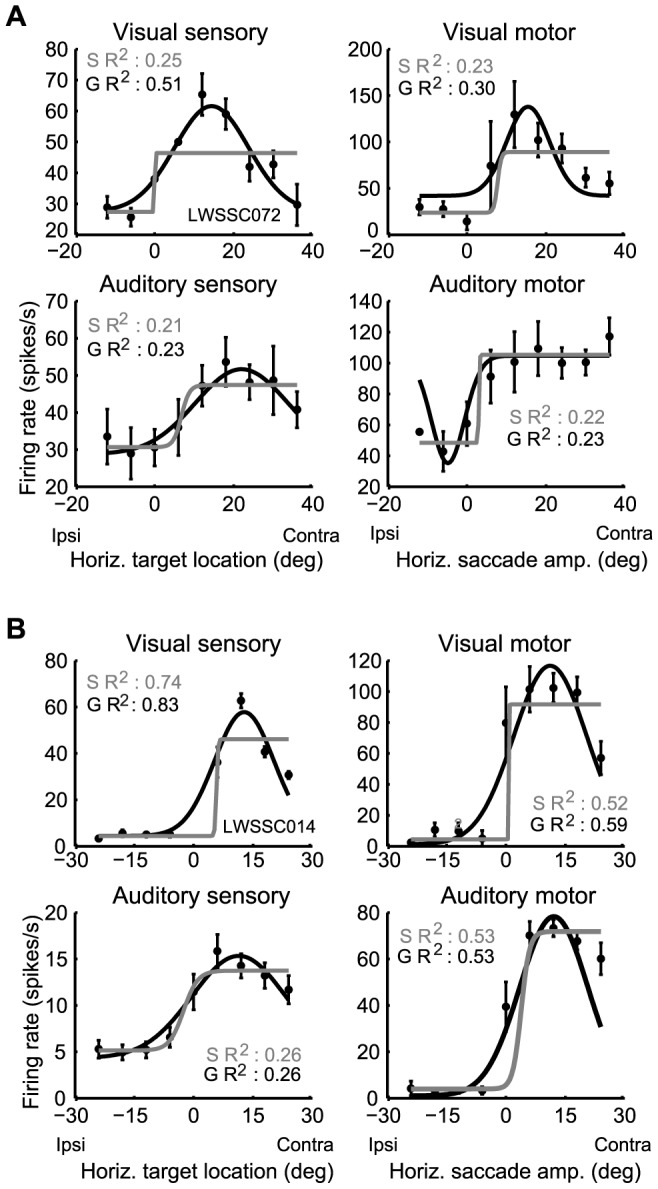
Figure 3. Two representative SC neurons (A, B) showing different sensitivity for visual and auditory stimuli.

(mean discharge rate +/− standard error with respect to the horizontal eye-centered target location or movement amplitude; S R2 and G R2 refer to the Sigmoidal and Gaussian R2 values). For three out of the four visual responses (upper panels), the fits of Gaussian function are significantly better than those of sigmoidal function (the sensory R2 values for A and B, and the motor R2 value for B; bootstrap analysis, p<0.05). In contrast, for the auditory responses (lower panels), the fit of both functions are about equally good (bootstrap analysis, p > 0.05).
