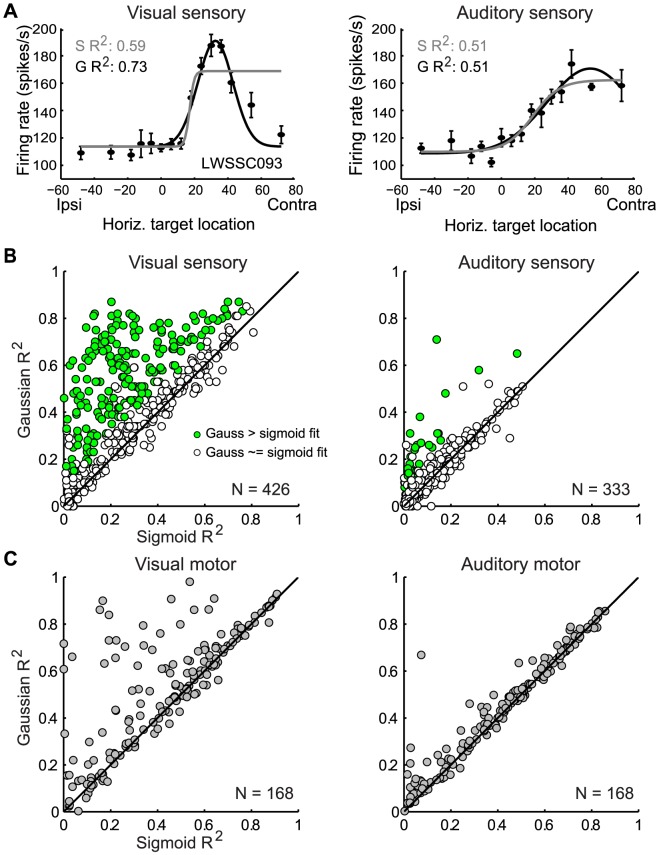
Figure 6. Two tests of the effect of sampling range.
Results in for an example neuron (A) tested out to 72° relative to the eye (ipsilateral fixation, interleaved non-saccade task). B. Population results, format similar to the corresponding panels of Figure 5A. C. Results for the motor period when excluding visual saccades that did not match the auditory saccade range. Only bimodal motor neurons are included in these panels; no bootstrap analysis of these curve fits was performed due to the limited numbers of trials available. All other details are as in Figure 5A.

