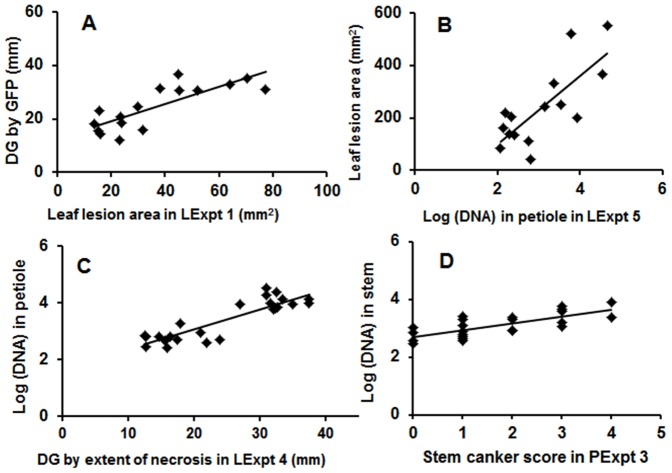
Figure 5. Relationships between different methods for assessment of quantitative resistance.
Different methods were used to assess growth of Leptosphaeria maculans in leaf petioles or in stems of doubled haploid lines A30 (susceptible) or C119 (with quantitative resistance). Relationships between leaf lesion area and distance grown (DG) by L. maculans in the leaf petiole viewed by GFP in experiment LExpt 1 (A; R 2 = 0.64) or amount of L. maculans DNA in leaf petiole in experiment LExpt 5 (B; R 2 = 0.59); or between amount of L. maculans DNA and DG in leaf petiole viewed by extent of necrosis in experiment LExpt 4 (C; R 2 = 0.78); or between amount of L. maculans DNA in the stem and stem canker severity score in experiment PExpt 3 (D; R 2 = 0.56). The amount of L. maculans DNA in the petiole or stem was log10-transformed. Details of these experiments are presented in Table 1.

