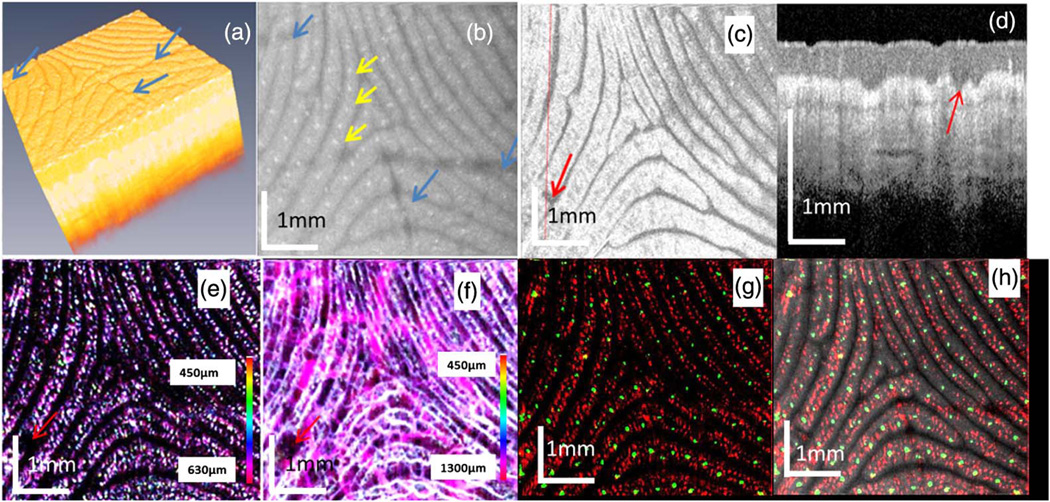
Fig. 3.
OCT images from a fingertip. (a) The 3D rendering of the OCT structure images. (b) The maximum intensity projection (MIP) image for the epidermis layers. (c) The en-face OCT image beneath the tissue surface and at a depth in the dermal papilla region. (d) An OCT image along the red dotted line in (c). (e) The MIP vascular pattern around the dermal papilla region. (f) The MIP vascular pattern for the whole depth. (g) Overlayed en-face images of sweat pores and capillary loop vasculature (450–630 µm). (h) Overlayed en-face images of sweat pores, capillary loop vasculature, and structure.

