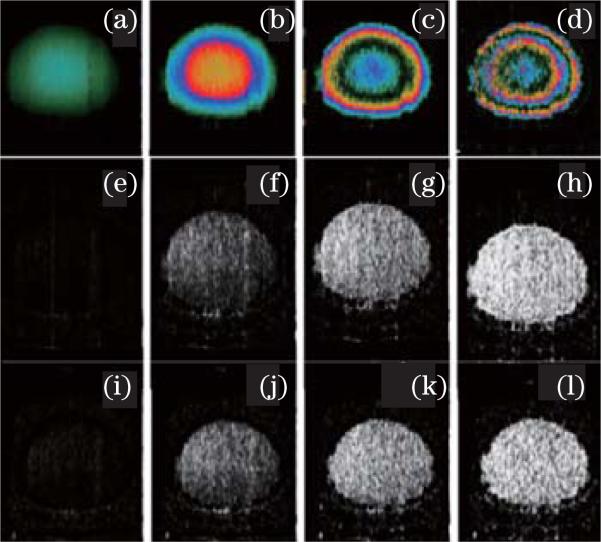
Fig. 5.
PR-D-OCT images processed with time intervals of, respectively, (a) 20, (b) 60, (c) 120, and (d) 200 μs. PRDV images processed with time intervals of, respectively, (e) 20, (f) 60, (g) 120, and (h) 200 μs. IBDV images processed with time intervals of, respectively, (i) 20, (j) 60, (k) 120, and (l) 200 μs.

