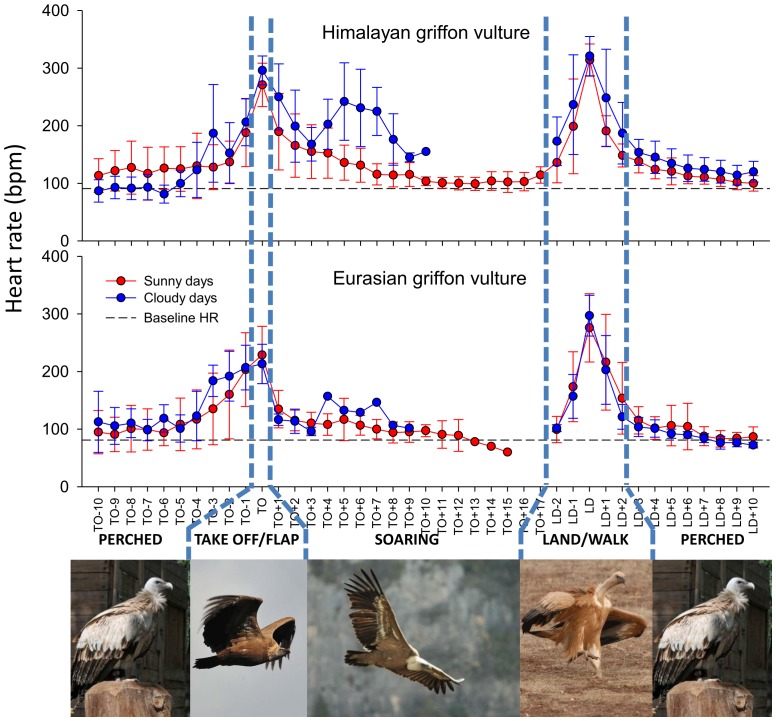
Figure 2. Variation of mean heart rate with weather conditions.
Mean heart rate (± SD) calculated every minute, before flight (TO-10 to TO-1), at take off (TO), during flight (TO+1 to TO+17), upon landing (LD-2 to LD+1) and after landing (LD+2 to LD+10) for two griffon vultures, in sunny (red) and cloudy days (blue). The horizontal line represents baseline HR (when perched).

