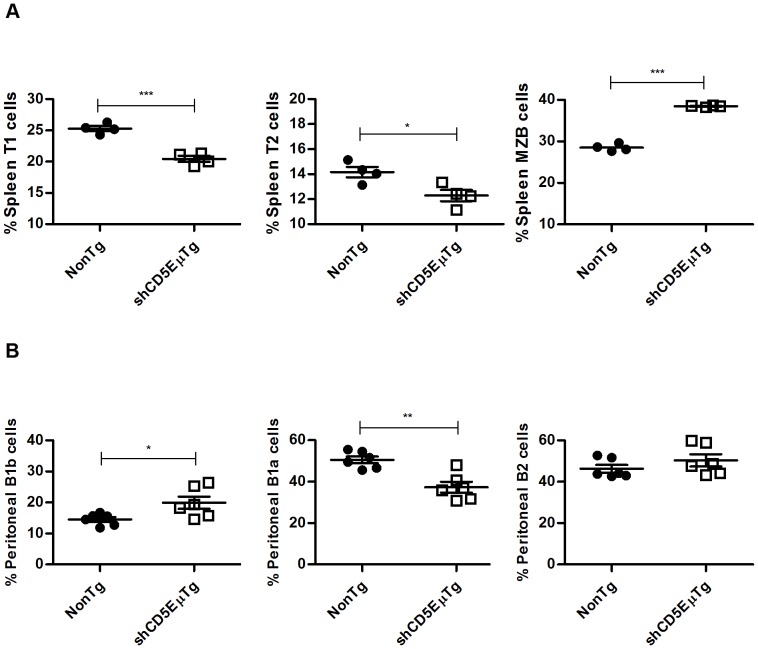
Figure 3. Flow cytometry analysis of B lymphocyte subpopulations in shCD5EμTg mice.
A) To analyze peripheral B cell subsets from spleens of shCD5 transgenic mice and non-transgenic littermates, we used a gating strategy adapted from Cariappa et al [45]. Gated on IgMhighIgDlow, transitional 1 (T1), transitional 2 (T2) and marginal zone B cells can be distinguished based on their differential expression of the surface markers CD23 and CD93/AA4. *** p≤0.0003 * p = 0.0221. B) Cells obtained from peritoneal lavage samples were stained to distinguish B1a cells (B220+IgMhighIgDlowCD5+), B1b cells (B220+IgMhighIgDlowCD5−) and B2 cells (B220+IgMhighIgDhighCD5−) in shCD5 transgenic mice and non-transgenic littermates. * p = 0.0294 ** p = 0.0016.

