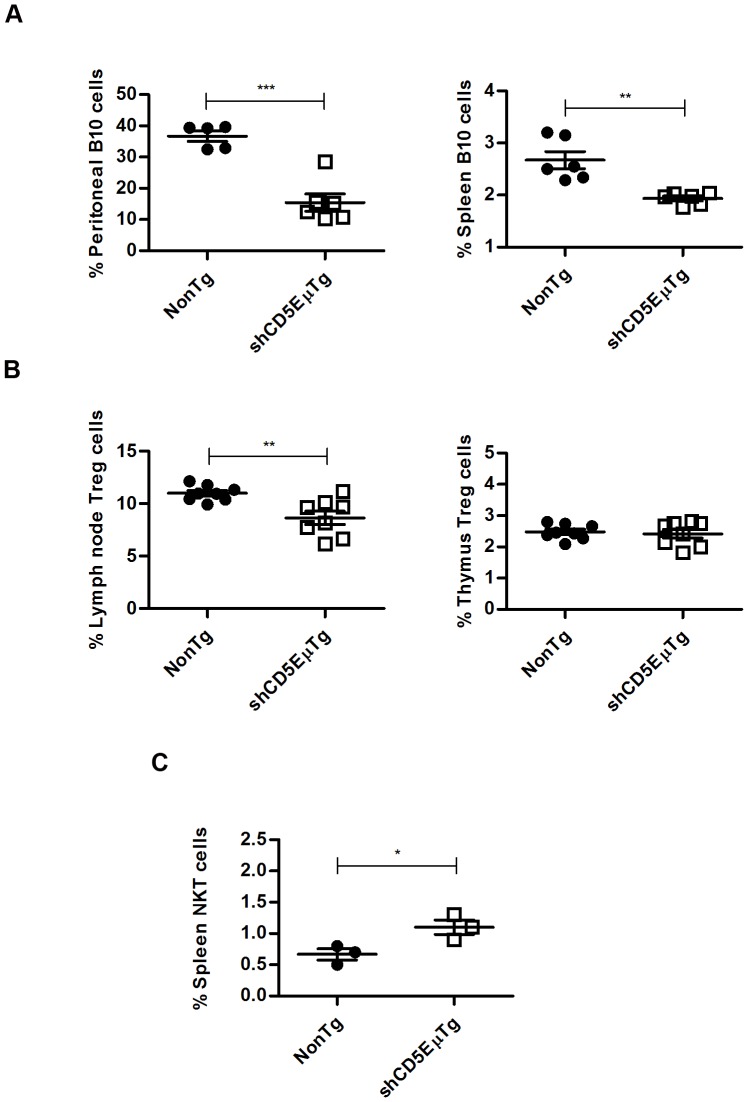
Figure 4. Flow cytometry analysis of T and B cells with regulatory phenotype in shCD5EμTg mice.
A) Cells from peritoneal lavage and spleen samples from shCD5EμTg mice and non-transgenic littermates were stained for the presence of Breg (B10) cells (B220+CD1d+CD5+IL10+). *** p≤0.0006 ** p = 0.0015. B) Lymph node and thymus cells were stained for the presence of Treg cells (CD4+CD25+ Foxp3+) in shCD5EμTg mice and in non-transgenic littermates ** p = 0.0038. C) Spleen cells were stained to detect NKT cells (CD3+NK1.1+) in shCD5EμTg mice and non-transgenic littermates. * p = 0.0406.

