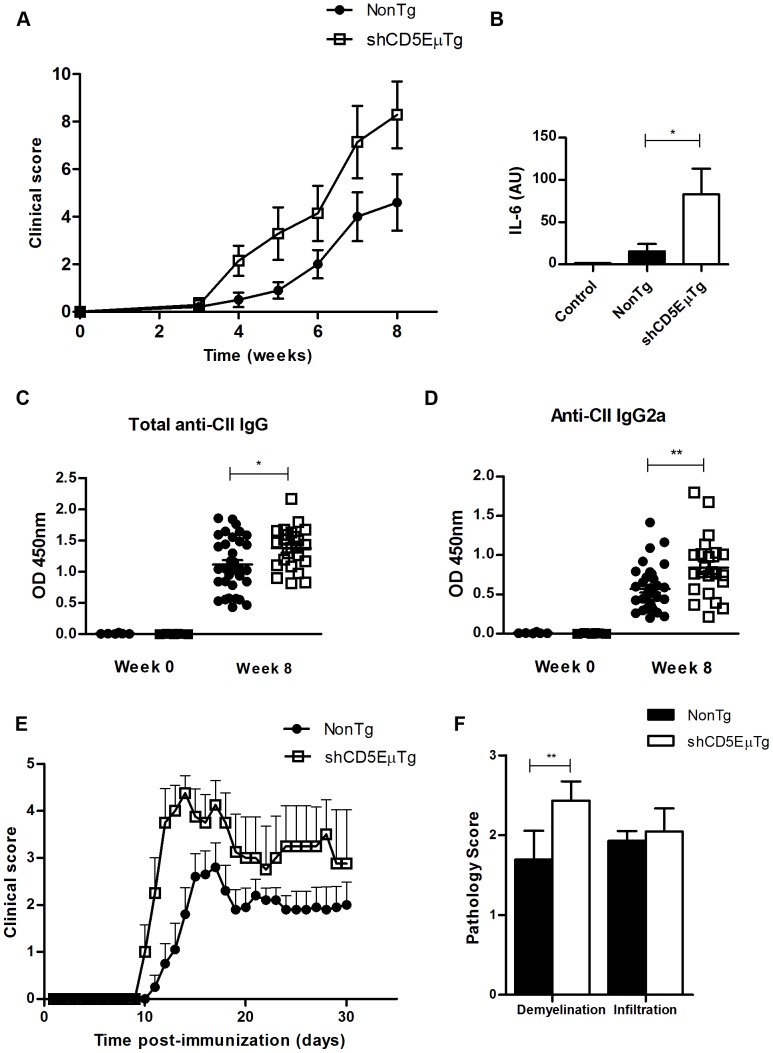
Figure 7. Exacerbated autoimmune disease in shCD5EμTg mice.
A) Analysis of CIA induction in (DBA_B6)F1×shCD5EμTg mice and non-transgenic littermates. 7–8 week old mice were immunized s.c. near the base of the tail with 100 µl of antigen (2 mg/ml type II bovine collagen) emulsified in CFA plus Arthrogen-CIA adjuvant. Radiological signs were scored weekly for each mouse and results for each group averaged to determine overall clinical score. B) IL-6 levels were determined by real time RT-PCR in joint tissue, normalizing results to GAPDH expression levels. Results are expressed in arbitrary units (A.U.). * p = 0.05. C) and D) Antibodies against type II collagen were measured by ELISA in the sera of (DBA_B6)F1×shCD5EμTg transgenic mice and non-transgenic littermates. Antibody determination included total IgG (C) and IgG1 (D). Results are expressed as OD 450 nm. E) Analysis of EAE induction in shCD5EμTg and non-transgenic mice. 8–10 week old mice were administered s.c. with 200 µl of antigen (50 µg MOG peptide) in CFA. At the time of immunization and 48 hs later, 200 ng of Pertussis toxin were also injected i.p. Clinical score was determined daily and it represents the average value for each mice, where 0 = no disease; 0.5 = partially motionless tail; 1 = motionless tail; 2 = ataxia; 3 = loss of mobility in one limb; 4 = loss of mobility in back limbs; 5 = moribund. Graphs show the comparison between clinical scores of shCD5EμTg (n = 5) and non-transgenic mice (n = 10). p = 0.05 (Two-way ANOVA test). F) Demyelination and infiltration scores, as detected by solochrome cyanin and hematoxylin and eosin staining, respectively. ** p = 0.02.

